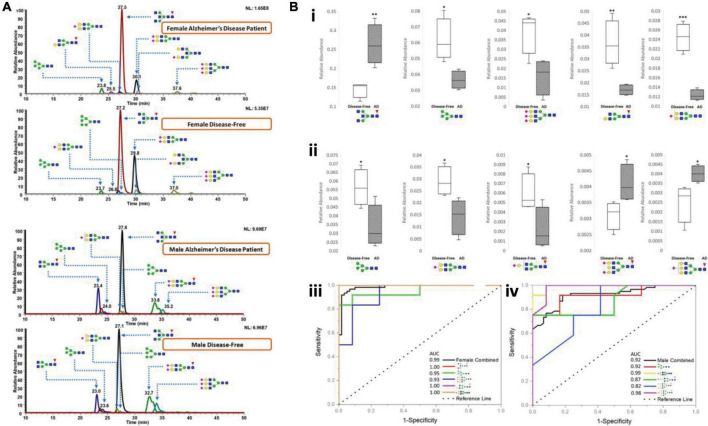
FIGURE 4.
(A) Representative chromatograms of various N-glycans, comparing N-glycan expression in CSF between female AD patients and female disease-free, and between male AD patients and male disease-free. (B) Box and ROC plots depict the comparison between relative abundances of N-glycan structures in female CSF (i) and in male CSF (ii) that are statistically significant among the abundant structures. Solids, disease-free; stripes, Alzheimer’s disease. ROC curves for female (iii) and male (iv). Some of the plots are hidden due to overlapping. Blue square, N-acetylglucosamine (GluNAc); yellow square, N-acetylgalactosamine (GalNAc); green circle, mannose; yellow circle, galactose; red triangle, fucose; purple diamond, sialic acid. Reproduced with the modification and permissions from Cho et al. (2019). *p < 0.05; **p < 0.01; and ***p < 0.001.

