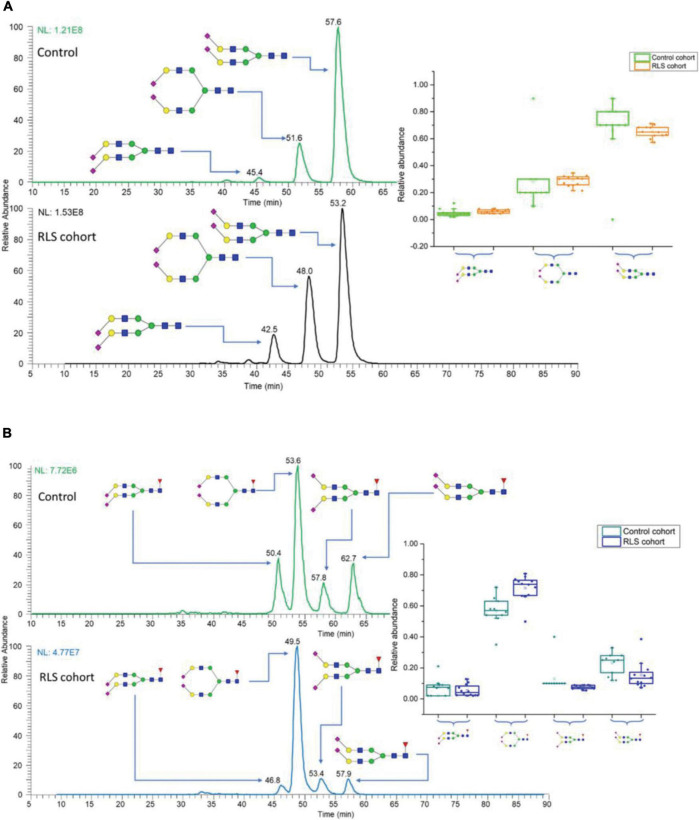
FIGURE 5.
EICs of N-glycan isomers with different linkages in control and restless legs syndrome (RLS) cohorts, separated on PGC (A) disialylated linkage isomers, (B) disialylated linkage isomers with core fucose connections. Insets are the box plots showing the distributions of disialylated isomers among 10 studied subjects in the control and 12 subjects in the RLS cohorts. The box stands for the first quartile and third quartile; the line represents median; and the whiskers above and below the box set the limits for outliers. Reprinted with the permission from Dong et al. (2020).

