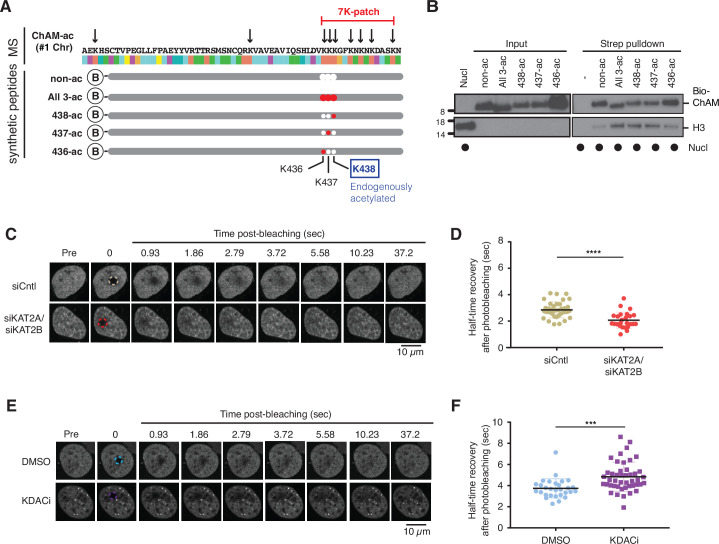
Figure 3. Acetylation within the 7K-patch enhances ChAM nucleosome association.
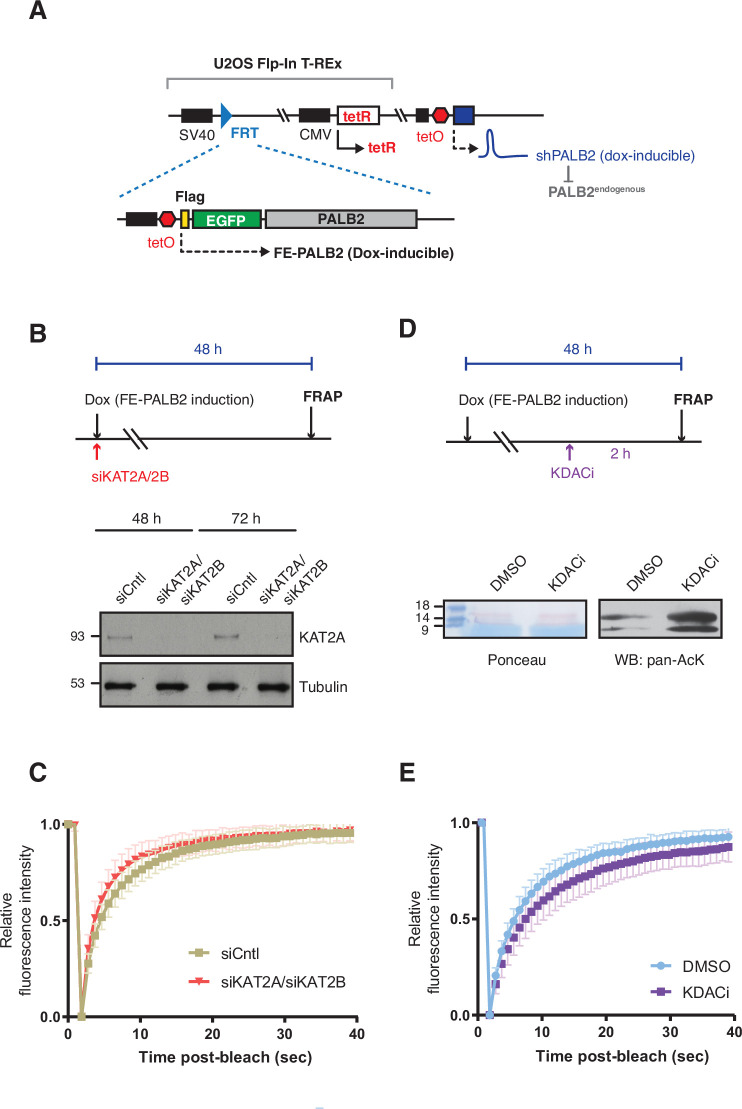
(A) In vivo acetylated lysine residues in chromatin-associated ChAM, detected by tandem MS analysis, are highlighted by arrows in the upper part (MS). Synthetic biotin-ChAM peptides non-acetylated (non-ac) or acetylated at single lysine residues 436 (436-ac), 437 (437-ac), and 438 (438-ac), or all three lysine residues (All 3-ac) are shown in the lower part. The position of the 7K-patch is highlighted in red. The position of the K438 residue, the endogenous target of KAT2A/2B within the ChAM (shown in Figure 1A), is highlighted in a box. (B) In vitro nucleosome binding assays for the synthetic biotin-ChAM peptides. After incubation with purified HeLa polynucleosomes in the presence of 5 µg salmon sperm DNA, biotin-ChAM peptides were pulled-down using streptavidin beads (Strep pulldown), and associated nucleosomes were detected by anti-histone H3 western blot. (C-D) FRAP assay of FE-PALB2 expressed in U2OS-shPALB2 cells, treated either with siRNA targeting KAT2A and KAT2B (siKAT2A/siKAT2B) or with negative control siRNA (siCntl). Representative images of live cells before bleaching (pre-bleaching) and during a 37.5 s recovery period (post-bleaching) are shown in (C), where dashed circles indicate bleached areas. FRAP data are quantified and plotted in (D). Dots represent values of half-recovery time (t1/2) for individual cells and bars mean values ± SD (siCntl, n=59; siKAT2A/2B, n=51). Statistical analyses were performed using GraphPad Prism 7.02 and p-values are for the unpaired Student’s t-test (*** p<0.0006). (E-F) As in C-D, except cells were treated with a cocktail of lysine deacetylase inhibitors (KDACi, 5 mM sodium butyrate, 5 µM trichostatin A, and 5 mM nicotinamide) or DMSO as a control. Representative images of live cells before bleaching (pre-bleaching) and during a 37.5 s recovery period (post-bleaching) are shown in (E), where dashed circles indicate bleached areas. FRAP data are quantified and plotted in (F). Dots represent values of half-recovery time (t1/2) for individual cells and bars mean values ± SD (DMSO, n=61; KDAC, n=94). Statistical analyses were performed using GraphPad Prism 7.02 and p-values are for the unpaired Student’s t-test (**** p<0.0001). Representative real-time cell images are shown in Figure 3—video 1 (siCntl), Figure 3—video 1 (siKAT2A/siKAT2B), Figure 3—video 1 (DMSO) and Figure 3—video 4 (KDACi).


