. 2022 Oct 21;11:e57736. doi: 10.7554/eLife.57736

Figure 5. ChAM 7K-patch mediates PALB2 global chromatin association.

(A) Western blot analysis of U2OS-shPALB2 cells constitutively expressing FLAG (EV) or FLAG-PALB2 variants. Where indicated, cells were treated with 2 µg/mL doxycycline (+Dox) to deplete endogenous PALB2. Lamin A was used as a loading control. (B-C) Subcellular distribution of FLAG-PALB2 variants in cytoplasmic (Cyt), nuclear soluble (Nuc) and chromatin-enriched (Chr) fractions upon doxycycline-induced PALB2 depletion. Histone H3 was used as a control for cellular fractionation. Protein levels, detected by western blotting, were quantified using ImageJ. PALB2 levels in the chromatin fraction were normalised against PALB2 levels in whole-cell extracts shown in (A) and expressed as a percentage of the WT in (C). Data indicate mean values ± SD from three independent experiments (n=3). Statistical analyses were performed using GraphPad Prism 7.02, and p-values are from the unpaired Student’s t-test for pairwise comparisons (ns, not significant; **** p<0.0001). (D-E) FRAP analysis of FE-PALB2 WT, 7R and 7Q in U2OS-shPALB2 cells in which endogenous PALB2 was depleted via doxycycline exposure. Representative images before bleaching (pre-bleaching) and during the recovery period (post-bleaching) are shown in (D), where dashed circles indicate bleached areas. FRAP data are quantified and plotted in (E). Dots represent values of half-recovery time (t1/2) for individual cells and bars mean values ± SD (WT, n=33; 7R, n=31; 7Q, n=26). Statistical analyses were performed using GraphPad Prism 7.02 and p-values are from the unpaired Student’s t-test for pairwise comparisons (ns, not significant; **** p<0.0001). Representative real-time cell images are shown in Figure 5—video 1 (WT), Figure 5—video 2 (7R) and Figure 5—video 3 (7Q).

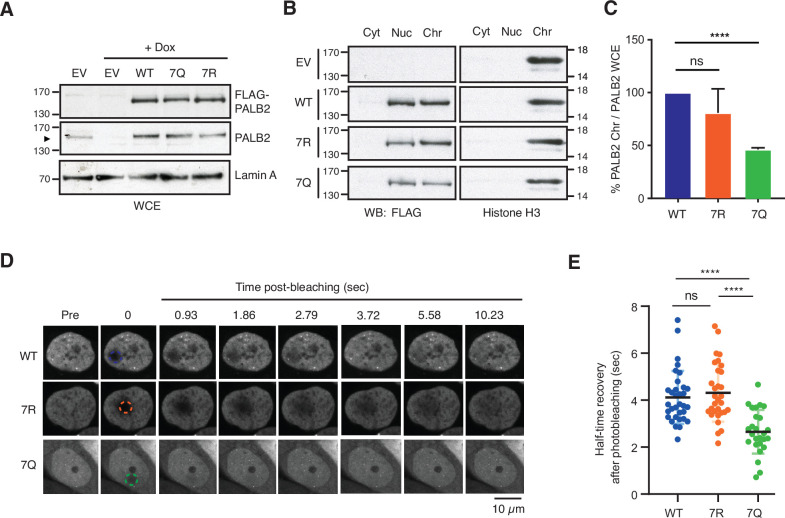
Figure 5—source data 1. Original images for Figure 5A.
Figure 5—source data 2. Original images for Figure 5B.
Figure 5—source data 3. Numerical data for Figure 5C and E.

Figure 5.

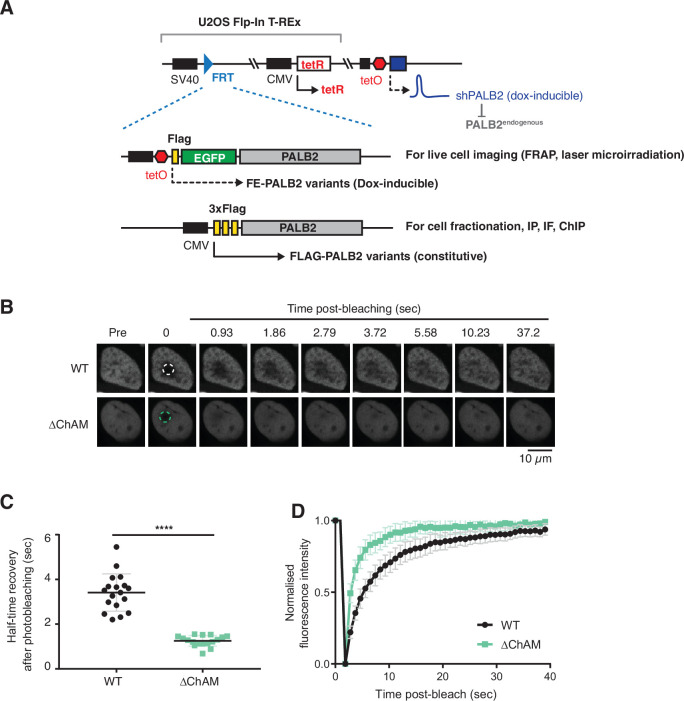
Figure 5—figure supplement 1. PALB2 ChAM limits its mobility.

Figure 5—figure supplement 1.

(A) Depiction of the cell lines used in this study. The U2OS-shPALB2 cell line was used as the parental cell line. FE-PALB2 variants under the tetO promoter or FLAG-PALB2 variants under the CMV promoter were integrated at a defined FRT site. (B-D) FRAP analysis of FE-PALB2 wild-type (WT) or harbouring an internal deletion of the ChAM (ΔChAM) conditionally induced in U2OS-shPALB2. Images of FE-PALB2 in live cells before bleaching (pre-bleaching) and during the recovery time after bleaching are shown in (B). FRAP data are quantified and plotted in (C). Dots represent values of half-recovery time (t1/2) for individual cells and bars mean values ± SD (WT, n=18; ΔChAM, n=17). Statistical analyses were performed using GraphPad Prism 7.02 and p-values are for the unpaired Student’s t-test (**** p<0.0001). Time plots of normalised mean fluorescence intensity of FE-PALB2 WT or ΔChAM within the bleached area relative to that of the whole-cell are shown in (D). Data represent mean values of relative florescence intensity ± SD. Representative real-time cell images are shown in Figure 5—video 4 (WT) and Figure 5—video 5 (ΔChAM).
Figure 5—figure supplement 1—source data 1. Numerical data for Figure 5—figure supplement 1C.
Figure 5—video 1. Representative FRAP image of FE-PALB2 WT expressed in U2OS cell, related to Figure 5D and E.
Download video file (497.6KB, mp4)
Figure 5—video 2. Representative FRAP image of FE-PALB2 7R variant expressed in U2OS cell, related to Figure 5D and E.
Download video file (494.3KB, mp4)
Figure 5—video 3. Representative FRAP image of FE-PALB2 7Q variant expressed in U2OS cell, related to Figure 5D and E.
Download video file (464.4KB, mp4)
Figure 5—video 4. Representative FRAP image of FE-PALB2 WT expressed in U2OS cell, related to Figure 5—figure supplement 1B and C.
Download video file (286.4KB, mp4)
Figure 5—video 5. Representative FRAP image of FE-PALB2 with an internal deletion of the ChAM (ΔChAM) expressed in U2OS cell, related to Figure 5—figure supplement 1B and C.
Download video file (149.6KB, mp4)