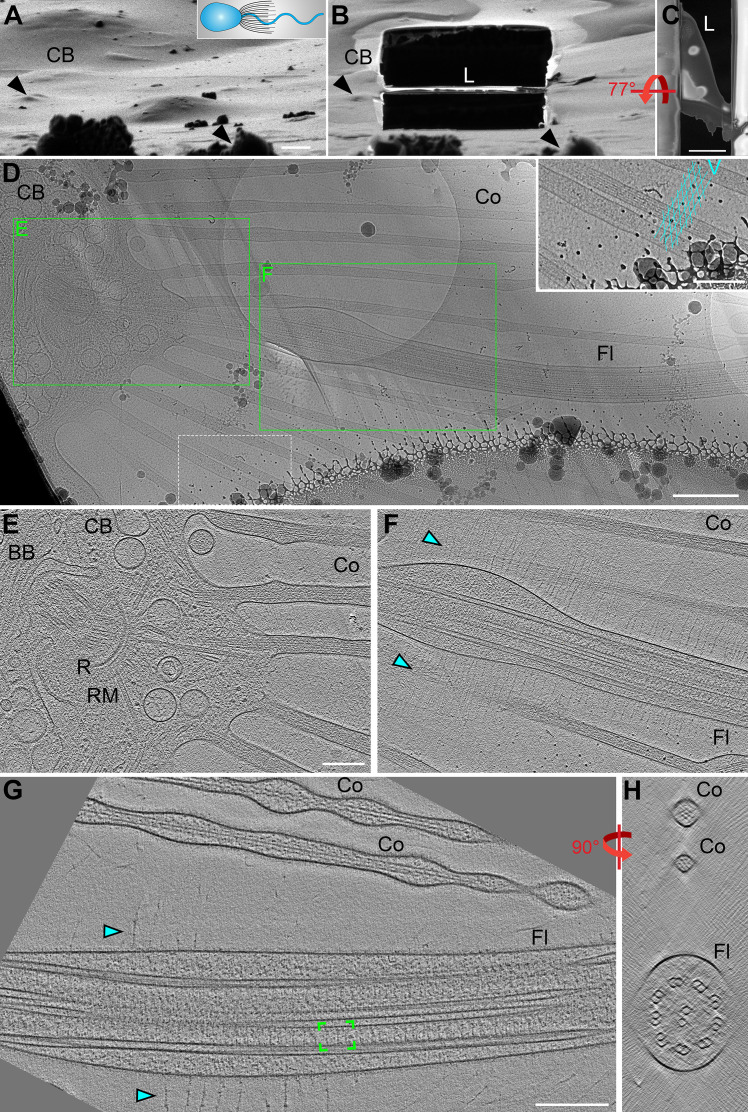
Figure 2. Cryo-FIB milling and cryo-ET enable visualization of flagellar structures.
(A,B) Choanoflagellate cell before (A) and after (B) cryo-FIB milling, as viewed by the ion beam. The cartoon denotes the cell’s orientation, with cell body (CB) to the left. Black arrowheads in A and B denote surface features in the ice to serve as landmarks for positional orientation. Note: the lamella (L) that includes the flagellum appears low relative to the cell body due to a visual illusion caused by the tilt and the several micron thick sputter/GIS-layer on top of the ice layer. (C) Perpendicular top view of the cryo-FIB milled lamella (shown in B) viewed with the electron beam. (D) Overview map of the milled flagellum (Fl), with green boxes indicating the positions of two sequential tomograms that were recorded from this lamella, shown in (E and F). The area within the white dashed line is magnified as an inset in the upper right corner, highlighting the regular meshwork of vane filaments which extend past the edges of the map. (E–F) Tomographic slices emphasizing the basal body (BB) and collar microvilli (Co) (E) and the proximal region of the flagellum (shown in F). Cyan arrowheads denote vane filaments. (G–H) Tomographic reconstruction of a whole (not cryo-FIB milled) S. rosetta flagellum in longitudinal (G) and cross-sectional (H) views. Green brackets indicate a single 96 nm axonemal repeat, thousands of which were used to generate the subtomogram averages shown in Figure 3. Other labels: R, ring of dense material (MTOC); RM, rootlet microtubules. Scale bars: 2 μm (C); 1 μm (A, applies also to B); 500 nm (D); 200 nm (D inset; E, applies also to F; G, applies also to H).

