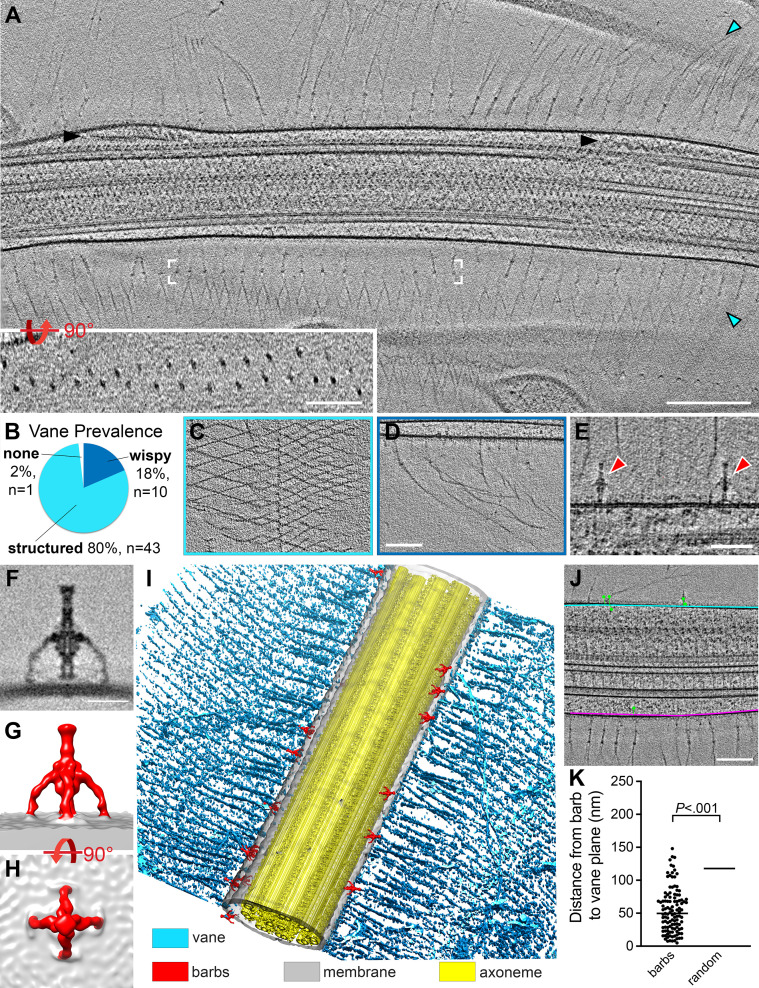
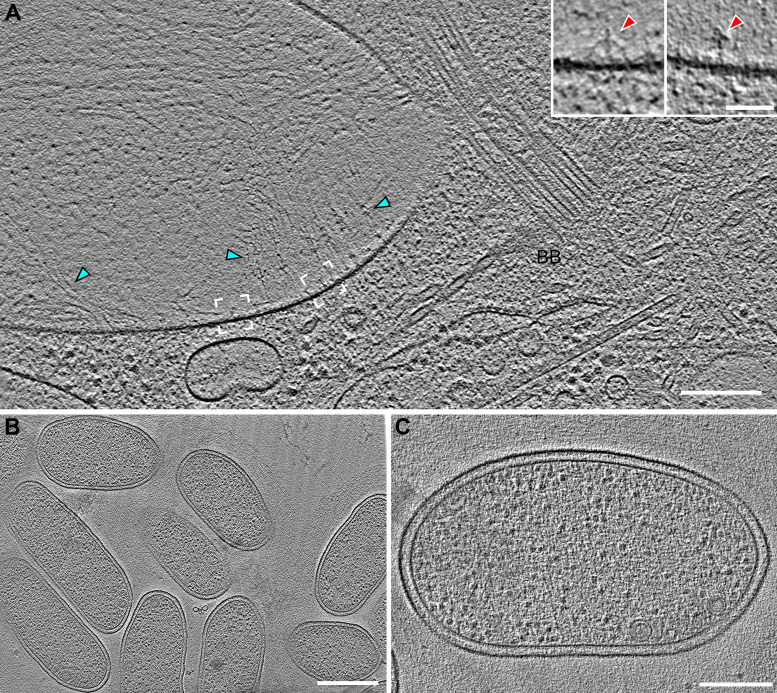
Figure 7. S. rosetta cells have a flagellar vane and adjacent barb structures.
(A) Tomographic slice through a representative flagellum showing bilateral vane filaments (cyan arrowheads) extending from the flagellar membrane. Black arrowheads denote IFT trains. White brackets mark the region shown in the rotated inset, which shows that the vane is a bilayer of thin filaments with semi-regular spacing. (B-D) Most tomograms contained vane filaments with regular patterning (“structured”, light blue color in (B), example tomographic slice shown in (C)), whereas a smaller proportion contained only individual “wispy” hairs (dark blue color in (B), example tomographic slice shown in (D)). Of the 54 tomograms included in our analyses, only one did not contain vane filaments. (E) Tomographic slice showing two barb structures (red arrowheads), approximately 50 nm in height that protrude from the flagellar membrane near the plane of the vane filaments (cyan arrowheads). (F-H) Tomographic slice (F) and isosurface renderings (G, H) show side (F, G) and top (H) views of the averaged barb structures (red, 4x symmetrized, 600 particles). (I) Compiled isosurface rendering of the S. rosetta flagellum, indicating positions of the vane (cyan) and barbs (red) relative to the flagellar membrane (gray); the axoneme is shown in yellow. (J) Tomographic slice through a flagellum; the bases of the vane filaments are marked in cyan and pink representing the vane planes; the green dots correspond to the centers of the barb structures in this region (note: the model thickness encompasses the entire flagellum, so most of the barbs themselves are not visible in the tomographic slice, except for the top-right barb). Green lines connect the barb particle to the vane plane with the shortest possible 3D distance (calculated using the mtk function in IMOD). The barb angles cause some to appear inside the membrane, though rotating the model would show that they are indeed protruding externally. (K) Quantification of the distances between the barb base to the nearest vane plane for 115 barb particles within 13 tomograms. The black, horizontal lines indicate the median values for the barbs (50 nm, left) compared to a ‘random’ distribution, which assumes equal likelihood of the barbs being located at any given point around the flagellar circumference (115 nm, right. Individual data points are not shown due to their high number and regular distribution). p=2x10-17. Figure 7—figure supplement 1 shows vane filaments and barbs on the plasma membrane within the flagellar pocket, but not on the surface of E. pacifica (bacterial prey). Scale bars: Scale bars: 200 nm (A and inset); 100 nm (D, applies also to C); 50 nm (E); 20 nm (F); 100 nm (J).


