. 2022 Oct 27;11:e79647. doi: 10.7554/eLife.79647

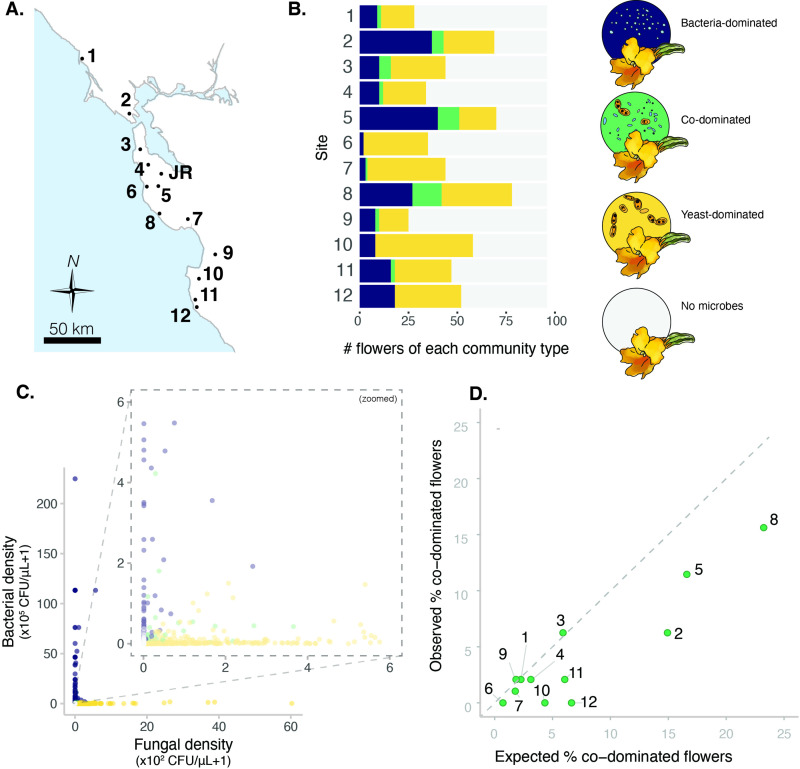
Figure 2. Sites vary in regional dominance of bacteria and yeast.

(A) Ninety-six Diplacus aurantiacus flowers were harvested from each of 12 field sites in and around the San Francisco Peninsula in California, USA (Figure 2—source data 1) with (B) variable numbers of flowers classified as bacteria-dominated (blue), fungi-dominated (yellow), co-dominated (green) flowers, or flowers where microbes were too rare to determine (grey) (n=1152). (C) Flowers are often dominated by bacteria or yeast, but rarely both. Each point represents a floral community and inset plot represents zoomed-in version of the plot behind it (n=1152). (D) Co-dominated flowers were observed less frequently than expected. In panel D, each point represents a site, with the numbers indicating the site numbers shown in panels A and B. In panel A, the location of Jasper Ridge Biological Preserve (JR) is also indicated (n=12).

Figure 2—source data 1. Field sites in Diplacus aurantiacus field survey.
Figure 2—source data 2. Association between percentage of flowers colonized by yeast or bacteria per plant and the distance between host plants.
To determine whether climatic factors and seasonality influence microbial abundance in this system, WorldClim bioclimatic variables (average annual mean temperature, temperature seasonality, and average monthly precipitation) were extracted for each plant and site. These variables, along with sampling date, were modeled as variables predicting bacterial and fungal abundance, respectively, in a linear mixed model with site as a random effect.
Figure 2—source data 3. Association between bioclimate variables, date of sampling, and microbial colonization.
Linear mixed model predicting bacterial or yeast abundance by average annual temperature (WorldClim bio1), temperature seasonality (WorldClim bio4), annual precipitation (WorldClim bio12), sampling date, with site location included as a random effect (n=144).

Figure 2.

Figure 2—figure supplement 1. Preliminary association between flow cytometry cell counts (populations identified by forward and side scatter) and colony forming units of A. nectaris growing on tryptic soy agar with cycloheximide.
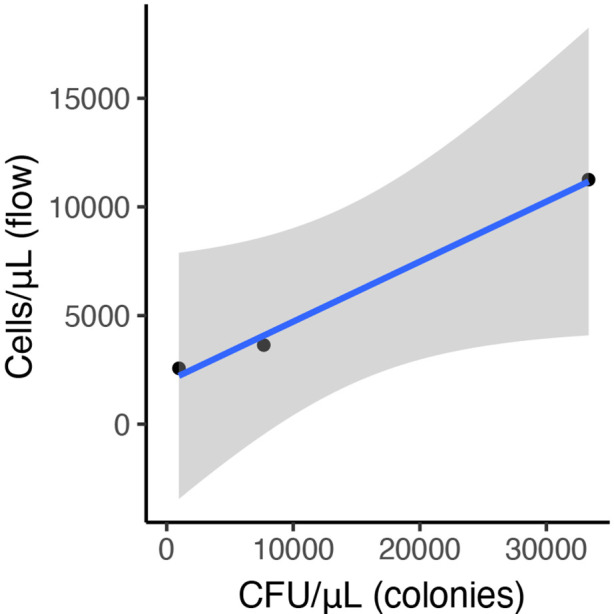
Figure 2—figure supplement 1.

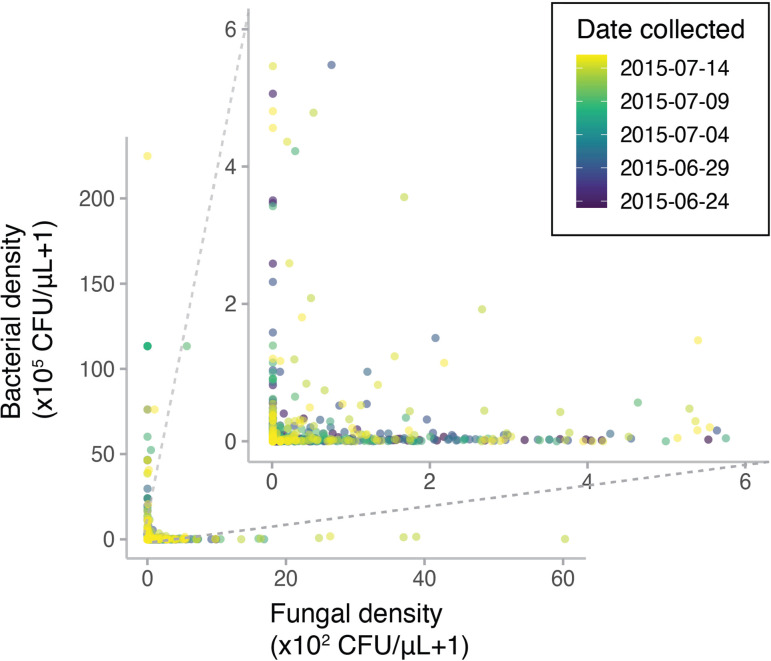
Figure 2—figure supplement 2. Diplacus aurantiacus flowers were harvested from 12 field sites in and around the San Francisco Peninsula (California, USA) at various dates in June and July 2015 with variable densities of bacteria and yeast (n=1152).

Figure 2—figure supplement 2.

Points are colored by the date each flower was sampled.
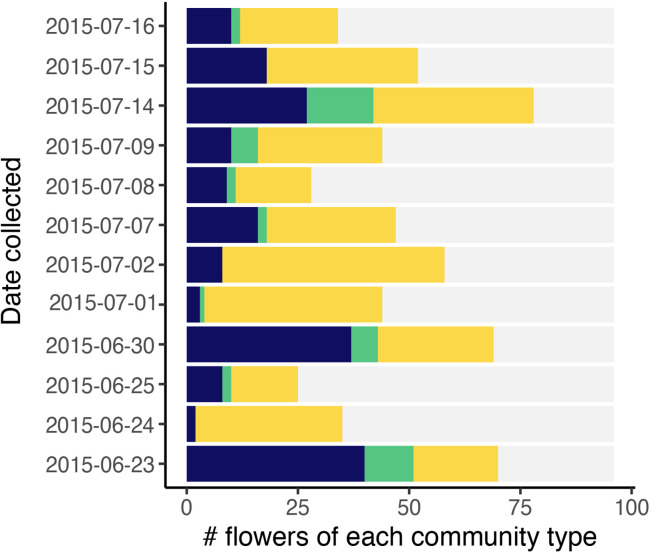
Figure 2—figure supplement 3. Classification of flowers into bacteria-dominated (blue), yeast-dominated (yellow), co-dominated (green), or microbes too rare to determine (grey).

Figure 2—figure supplement 3.

Each point represents a floral community. Bars are ordered by the date sampled (n=1152).
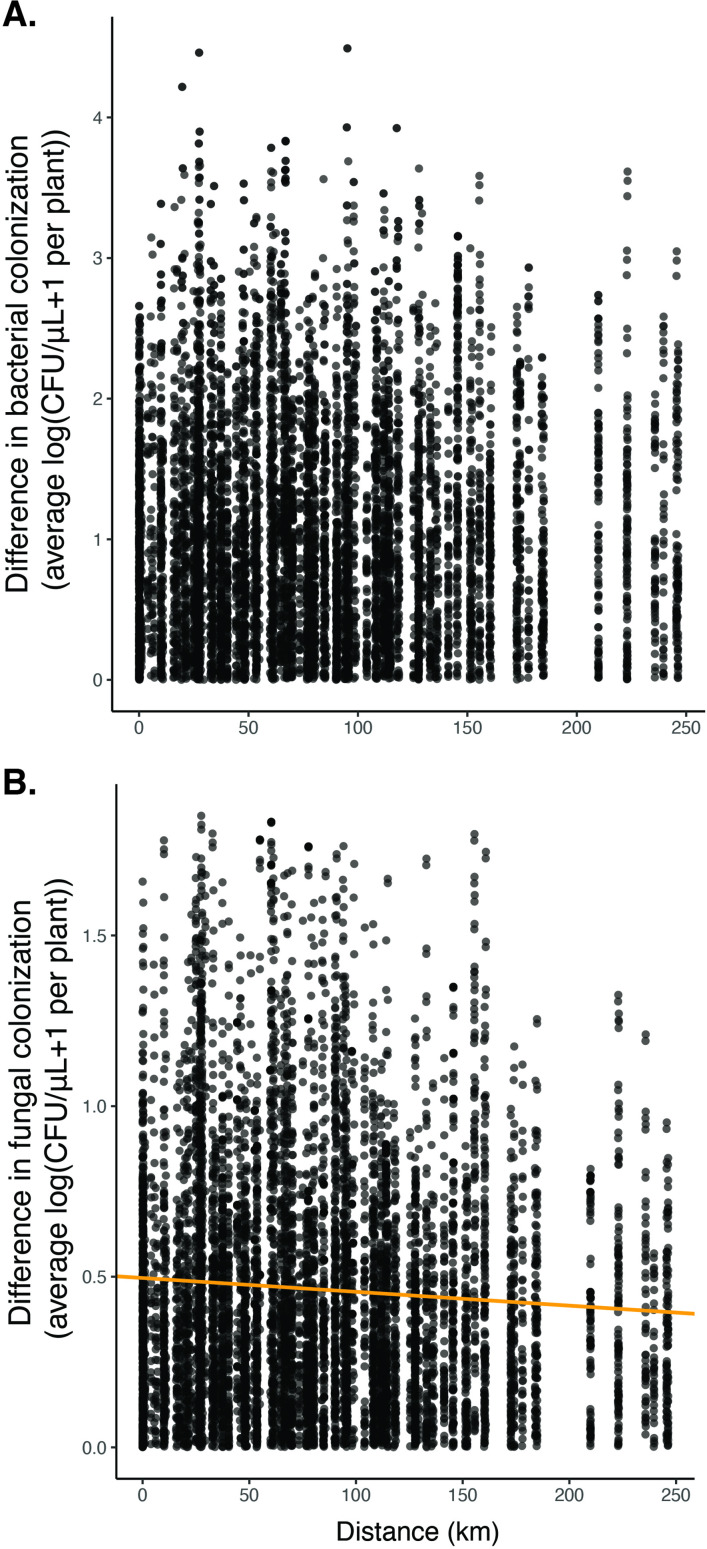
Figure 2—figure supplement 4. We found no significant relationship between distance and the difference in bacterial colonization (A, n=8775, p=0.07, R2=0.0003) and a slightly negative association between distance and the difference in fungal colonization (B, n=8775, p<0.05, R2=0.004).

Figure 2—figure supplement 4.

These results suggest that there was no obvious overall spatial pattern in whether flowers were dominated by yeast or bacteria.