. 2022 Oct 27;11:e79647. doi: 10.7554/eLife.79647

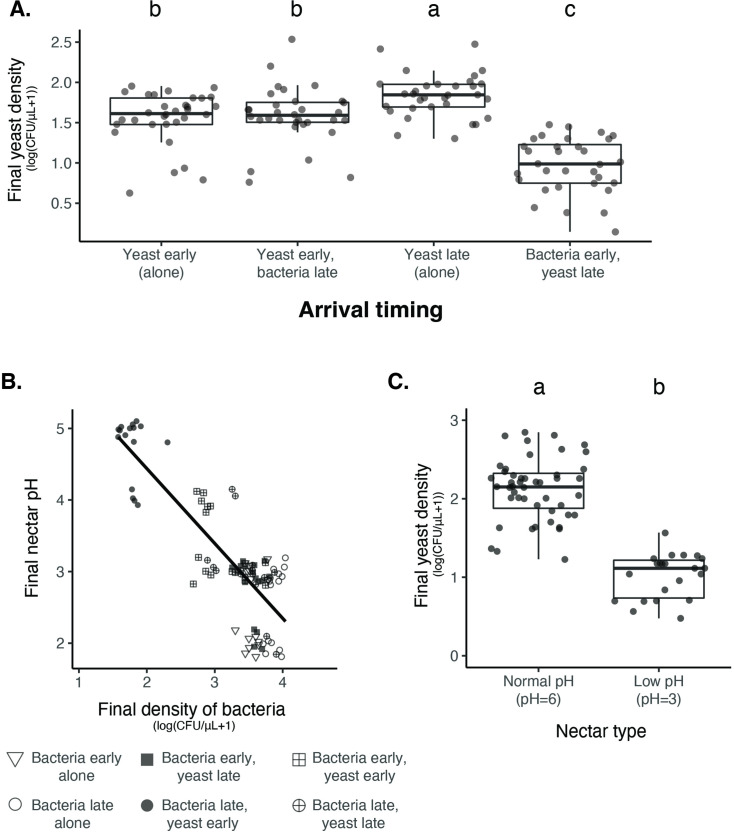
Figure 4. Nectar bacteria exert negative priority effects against nectar yeast, potentially due to reduction in nectar pH.

(A) Metschnikowia reukaufii (strain MR1) yeast population density after five days of growth with alternating arrival order with Acinetobacter nectaris bacteria or growth alone with inoculation on either the first or third day (arriving early or late) of the experiment (n=128). (B) Final pH of nectar after 5 days of bacterial growth; higher densities of bacteria are associated with lower pH. The shape of each point represents the treatments represented in panel A. Points are jittered on the y-axis (n=96). (C) Low pH (pH = 3) nectar depresses yeast growth when grown in low-density monoculture (n=72). In box plots (panels A and C), treatments that share the same letter placed above their boxes were statistically indistinguishable from one another.

Figure 4—source data 1. Priority effect experiment treatments.
Treatments used in priority effects experiment with ancestral yeast, fully factorial experiment testing the effect of arrival order on priority effects.
Figure 4—source data 2. Priority effect experiment results.
Results from a linear mixed model testing the effect of arrival order on yeast growth, where BY and YB represents initial arrival by bacteria or yeast, respectively. -Y and Y- represent the comparable growth of yeast at either arrival time (day 0 or day 2). Bold text shows p-values less than or equal to 0.05.

Figure 4.

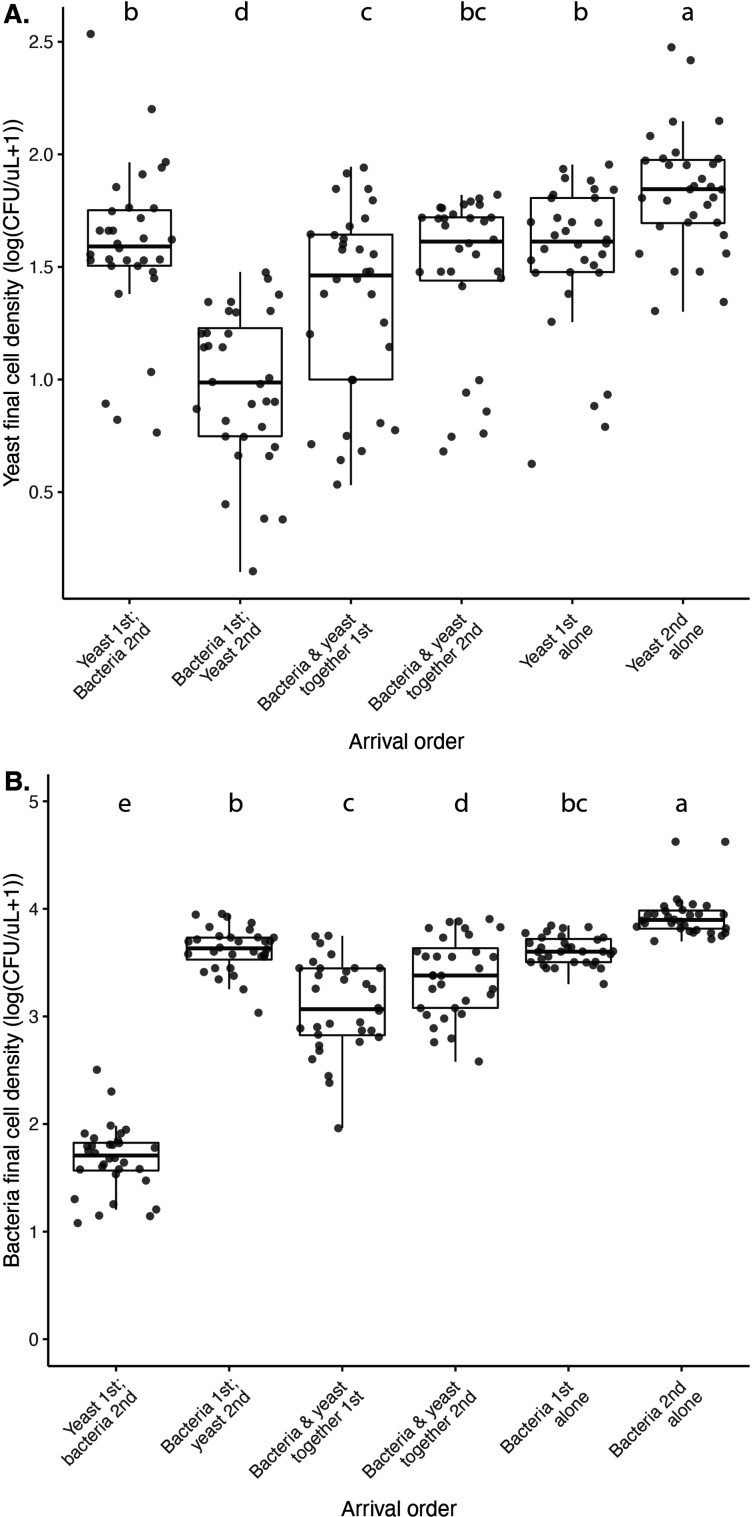
Figure 4—figure supplement 1. M. reukaufii yeast and A. nectaris bacteria exhibit negative priority effects against each other, as evidenced by growth in microcosm experiments where arrival order is altered.

Figure 4—figure supplement 1.

Statistical analysis for significance codes are in Figure 4—source data 2 for yeast (a) and bacteria (b). Letters shown above each box (each treatment) indicate statistical significance as in Figure 4.
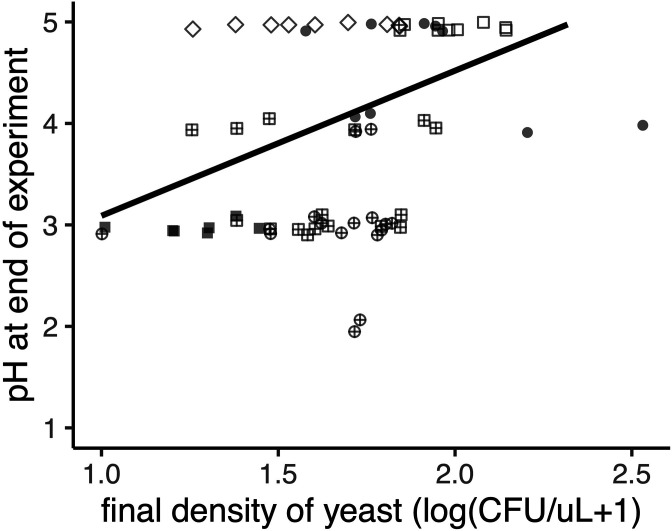
Figure 4—figure supplement 2. Yeast increases nectar pH (p<0.05, Spearman rank correlation).

Figure 4—figure supplement 2.

The shape of each point represents the various treatments (described in Figure 3B), where yeast first, then bacteria (‘YB’) are filled circles, bacteria first followed by yeast (‘BY’) are filled squares, early arriving bacteria and yeast (‘YB-’) are cross-hatched squares, late arriving bacteria and yeast (‘BY-’) are cross-hatched circles, late arriving yeast (‘-Y’) are open squares, early arriving yeast (‘Y-’) are open diamonds, late arriving bacteria (‘-B’) are open circles, and early arriving bacteria (‘B-’) are triangles. Points are slightly jittered on the y axis.
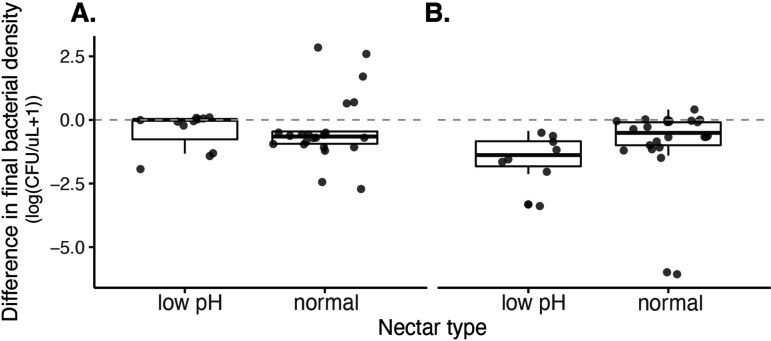
Figure 4—figure supplement 3. We found no effect of nectar type (pH=3, pH=6) on the growth of M. reukaufii, when grown in monoculture at a high density (approximately 10,000 cells/µL).
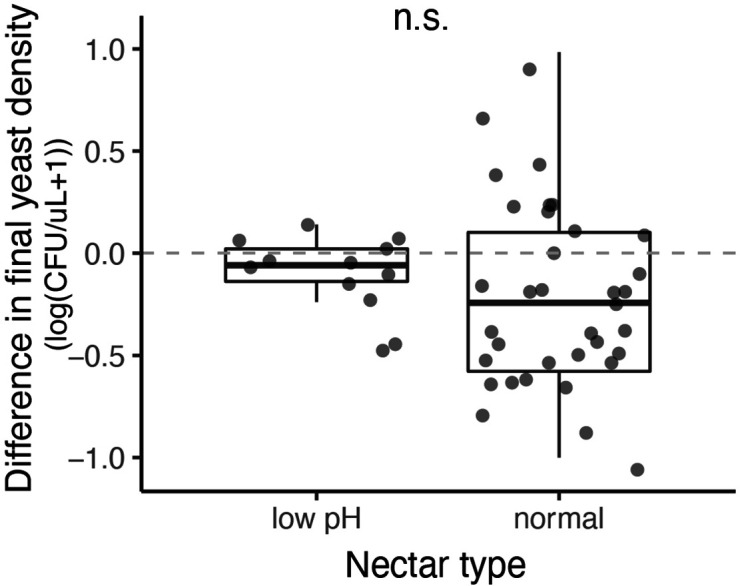
Figure 4—figure supplement 3.

M. reukaufii growth was calculated by subtracting the initial from final cell density. Positive values represent instances of population growth whereas negative values represent instances of population decline.
Figure 4—figure supplement 4. We found no effect of nectar type (pH=3, pH=6) on the growth of A. nectaris when grown in monoculture at a low density (approximately 10 cells/µL) (A) or high density (approximately 10,000 cells/µL) (B).

Figure 4—figure supplement 4.

A. nectaris growth was calculated by subtracting the initial from final cell density. Positive values represent instances of population growth whereas negative values represent instances of population decline.