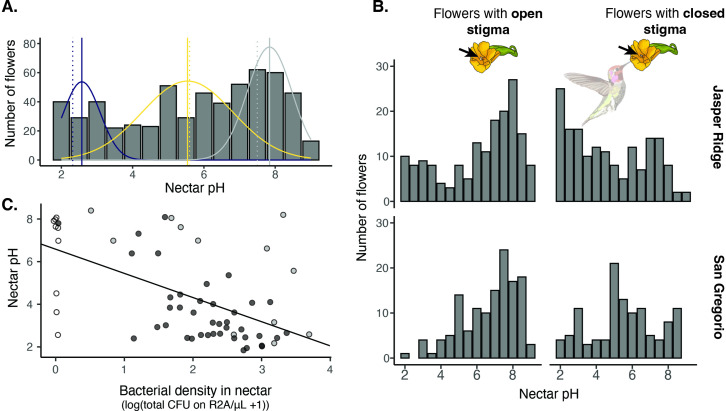
Figure 5. Field survey of nectar pH in D. aurantiacus.
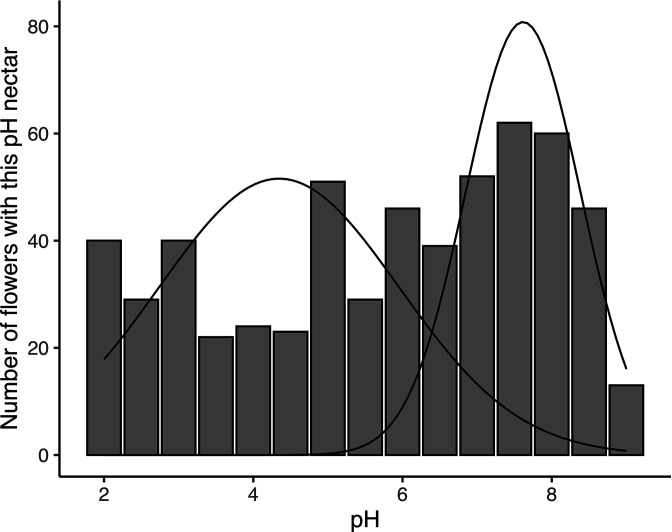
(A) Distribution of nectar pH in individual D. aurantiacus flowers collected at Jasper Ridge and San Gregorio (n=576 flowers from which we were able to extract a sufficient amount of nectar to measure pH; 21% of flowers sampled, i.e.,152 of 728 flowers, had too little nectar for pH measurement). The tri-modal distributions represent the prediction from a 3-part mixture model, with the modes indicated by solid vertical lines. Dashed vertical lines indicate experimental pH measurements from Vannette et al., 2013, where bacteria (blue dashed vertical line) and yeast (yellow dashed vertical line) were grown in field-collected D. aurantiacus nectar (control as grey dashed vertical line), and pH was measured after four days of growth. (B) Distributions of nectar pH amongD. aurantiacus flowers with open and closed stigmas (a closed stigma indicatesvisitation by a pollinator in D. aurantiacus; Fetscher and Kohn, 1999) shown separately for Jasper Ridge and San Gregorio (site 6). At Jasper Ridge, 71/233 and 37/204 flowers with closed and open stigma, respectively, had too little nectar to measure pH. At San Gregorio, 31/145 and 13/146 flowers with closed and open stigma, respectively, had too little nectar to measure pH. (C) Association between bacterial density in individual flowers and nectar pH (n=62). White points represent flowers where no microbes were cultured on R2A, but some colonies were present on TSA. Grey points represent flowers where yellow colonies were present on R2A at a greater density than other colonies on R2A. Preliminary data suggest that these yellow colonies represent non-acidifying bacteria such as Pseudomonas. Black points represent flowers with colonies on R2A that do not fit into either of the prior categories. The regression line was shown for all data.


