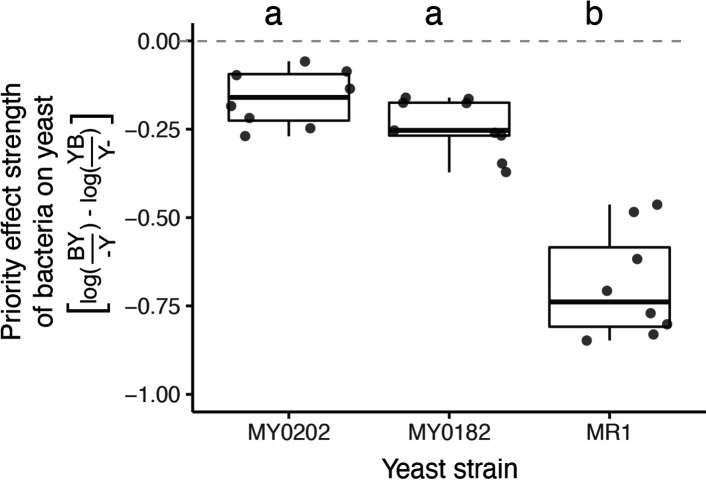
Figure 6. M. reukaufii strains differ in susceptibility to bacterial priority effects.
Three strains of M. reukaufii were differentially affected by early arrival of bacteria (n=25). For each strain, we calculated the strength of priority effects using a metric that compares growth between varying initial inoculation densities with a competitor and alone. BY and YB represents initial dominance by bacteria or yeast (e.g. BY represents bacteria arriving early and yeast arriving late). Y- and -Y represent the comparable growth of yeast at either density (early or late) alone. Letters shown above each box (each treatment) indicate statistical significance as in Figure 4.

