. 2022 Oct 27;11:e79647. doi: 10.7554/eLife.79647

Figure 7. Yeast evolved with bacterial niche modification were more resistant to bacterial priority effects.

(A) Yeast evolved in low-pH nectar was less affected by bacterial priority effects than other treatments, especially compared to ancestral yeast and yeast evolved in normal nectar (n=72). Consequently, (B) yeast evolved in bacteria-like nectar (both bacteria-conditioned and low-pH) was less negatively affected by initial bacterial dominance, relative to their growth alone, than ancestral yeast or yeast evolved in normal nectar (n=168). Letters shown above each box (each treatment) indicate statistical significance as in Figure 4.

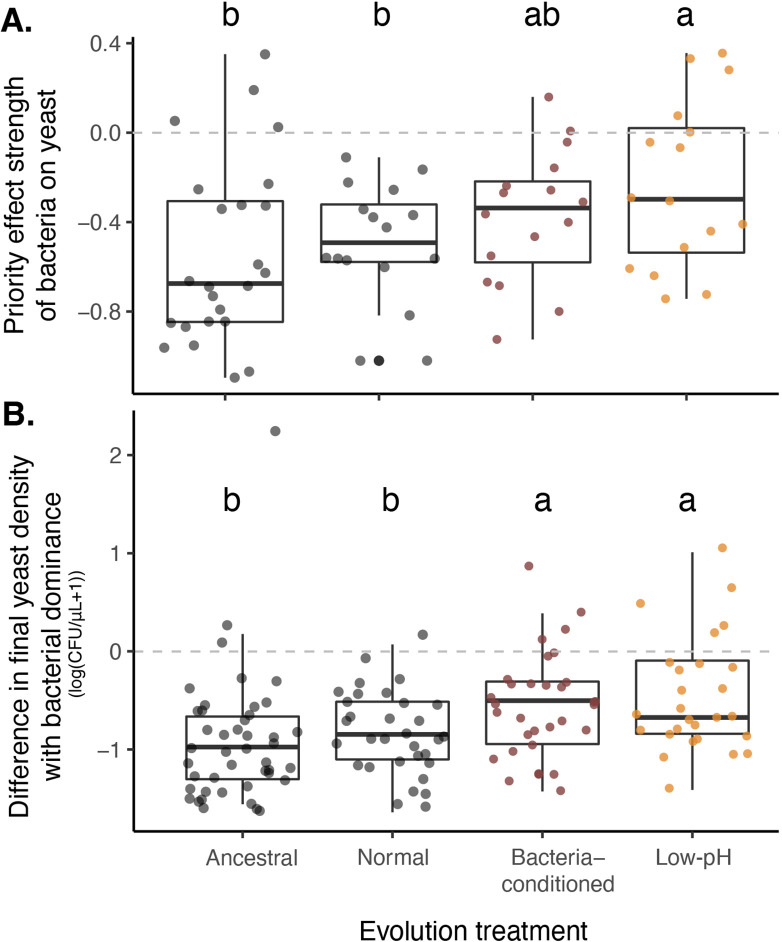
Figure 7—source data 1. Evolution treatments.
Treatments used in priority effects experiment with experimentally-evolved yeast, fully factorial experiment testing the effect of initial density (10,000 cells/µL (‘early’) or 10 cells/µL (‘late’)), evolution treatment (ancestral, evolved in normal nectar, low-pH nectar, or bacteria-conditioned nectar), and evolutionary replicate (independent evolutionary lineages) on priority effects.
Figure 7—source data 2. Priority effect experiment results with evolved strains (priority effect metric).
Results from a linear mixed model testing the effect of evolution treatment (ancestral, evolved in normal nectar, low-pH nectar, or bacteria-conditioned nectar) on the strength of priority effects calculated using one of two metrics: Priority effect metric #1: (Figure 7),PE1=log(BY-Y)-log(YBY-) where BY and YB represent initial dominance by bacteria or yeast, respectively. -Y and Y- represent the comparable growth of yeast at either density, alone and treatment densities were averaged by round of the experiment. Bold text shows p-values less than or equal to 0.05. Priority effect metric #2: (Figure 7—figure supplement 1).,PE2=log(BYYB) where BY and YB represent initial dominance by bacteria or yeast, respectively. Treatment densities were averaged by round of the experiment. Bold text shows p-values less than or equal to 0.05.
Figure 7—source data 3. Differences in growth between evolved strains with and without bacteria.
Results from a linear mixed model testing the effect of yeast initial density (10,000 colony forming units/µL (‘early’) or 10 cells/µL (‘late’), yeast monoculture or competition with bacteria) treatment and evolution treatment (ancestral, evolved in normal nectar, low-pH nectar, or bacteria-conditioned nectar) on the difference in final yeast density between treatments with a high density of bacteria and a low density of yeast (BY) and yeast grown in monoculture at a low density (-Y). Growth difference was calculated as (BY) - (-Y). Bold text shows p-values less than or equal to 0.05.
Figure 7—source data 4. Difference in final yeast densities between evolved strains with and without bacteria.
Results from a linear mixed model testing the effect of yeast initial density (10,000 colony forming units/µL (‘high’) or 10 cells/µL (‘low’), yeast monoculture or competition with bacteria) treatment and evolution treatment (ancestral, evolved in normal nectar, low-pH nectar, or bacteria-conditioned nectar) on final density of yeast. Bold text shows p-values less than or equal to 0.05.

Figure 7.

Figure 7—figure supplement 1. We calculated an additional priority effect metric, which corroborated our main result.

Figure 7—figure supplement 1.

This metric is calculated by taking the natural logarithm of growth ratio between different initial dominance:PE=log(BYYB). Letters shown above each box (each treatment) indicate statistical significance as in Figure 4.
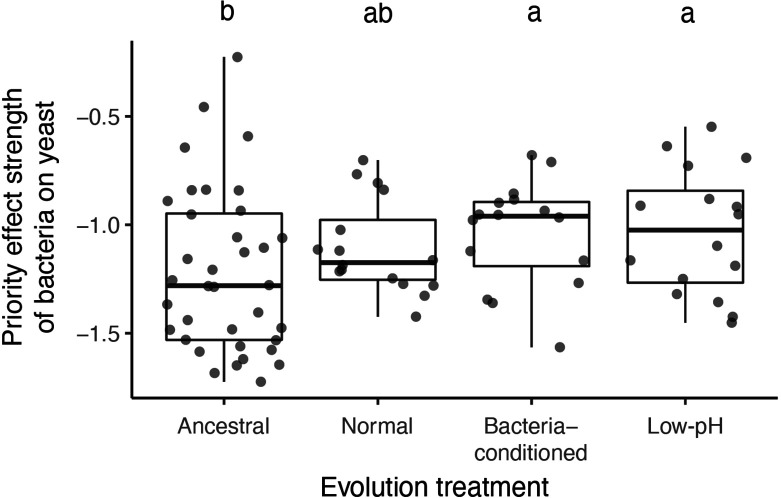
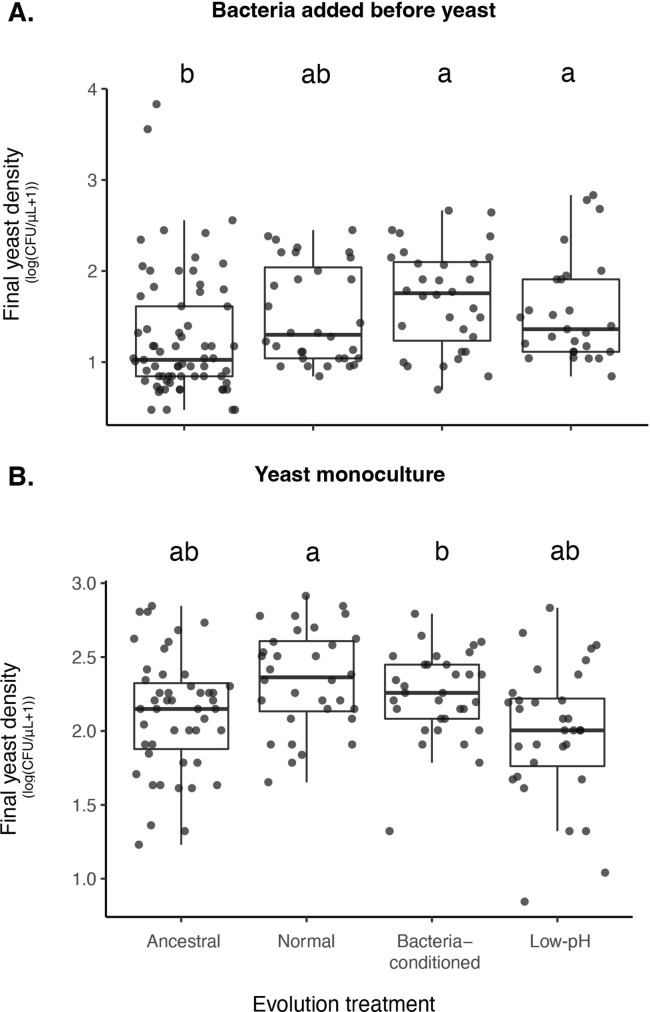
Figure 7—figure supplement 2. Effects of evolution treatments and bacterial addition on yeast density.

Figure 7—figure supplement 2.

(A) Yeast evolved in bacteria-conditioned and low-pH nectars were better able to grow than ancestral yeast when bacteria were dominant (BY bacterial priority effects treatment). (B) This difference in growth was not due to a difference in intrinsic growth rate (-Y monoculture treatment). Letters shown above each box (each treatment) indicate statistical significance as in Figure 4.