. 2022 Oct 27;11:e79647. doi: 10.7554/eLife.79647

Figure 8. Relationship between resistance to priority effects and monoculture growth.

Strains that could more strongly resist priority effects by bacteria were poor at growing in monoculture (upper left quadrant). Conversely, strains that were more affected by bacterial priority effects were better able to grow in monoculture (upper right quadrant). Each point in the plot represents an evolved strain, plotted with respect to the ancestral strain grown in that round of the experiment (centered on the origin) (n=60).

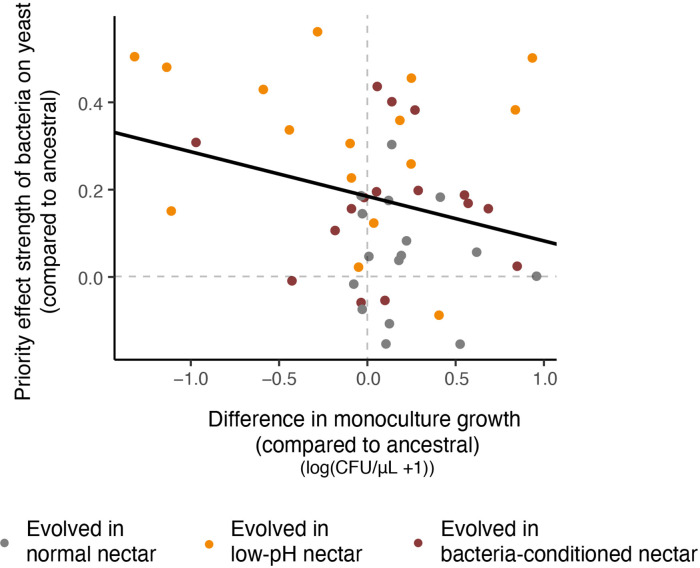
Figure 8—source data 1. Relationship between resistance to priority effects and monoculture growth.
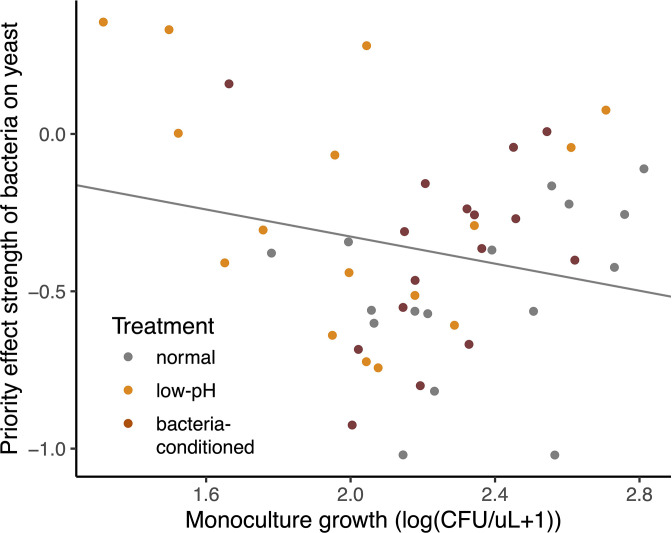
The relationship between monoculture growth and resistance to priority effects was calculated using a linear mixed model predicting the difference in the strength of priority effects from the monoculture growth. Both of these values were comparing each evolved strain to the ancestral strain within a single weekly iteration of the experiment, which was also included as a random effect. Additional model associated with Figure 8—figure supplement 1: (raw data for evolved strains not adjusted for ancestral).

Figure 8.

Figure 8—figure supplement 1. Negative relationship between the strength of priority effects of bacteria and yeast on their monoculture growth rate at a low density, with round of the experiment (week) as a random effect (LMM: n=48, p=0.006).

Figure 8—figure supplement 1.

Note that this data is not adjusted for differences between ancestral strains within rounds, as in Figure 7.