. 2022 Oct 27;11:e79647. doi: 10.7554/eLife.79647

Figure 9. Yeast evolved to synthetic nectar.

(A) Heat map depicting treatment-specific loss of heterozygosity (LOH). Columns represent individual samples (independent evolutionary trajectories) and rows represent single sites with LOH. White or light red/orange boxes indicate sites without LOH, while dark grey boxes represent a site with LOH. Sites selected for the figure exhibited FST >0.3 and permutation-derived p-value <0.1 when comparing the ancestral strain and one of the evolved clones at that site. Boxes with dashed lines are highlighted examples of sites that are potentially adaptive in low-pH nectar, both low-pH and bacteria-conditioned nectar, and normal nectar but not the other two nectar types. (B) Distribution of putative de novo mutations across the genome in 50 kB windows and separated by treatment. Dots represent the sum of putative de novo mutations in a 50 kB window, per treatment (n=146).

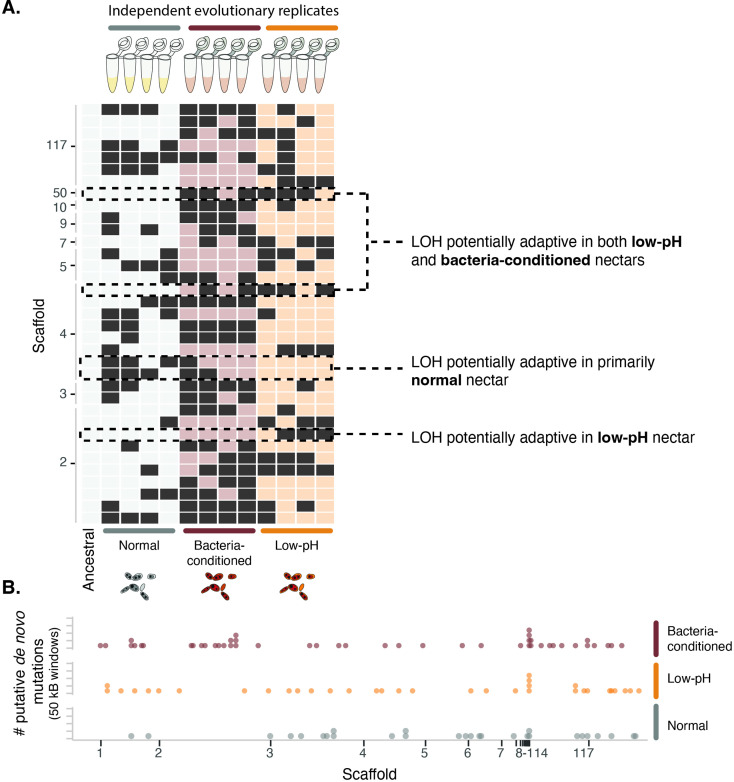
Figure 9—source data 1. Sequencing and mapping QC.
Mapping summary of evolved and ancestral genomes. Link to full MultiQC report. The average per sample, genome-wide coverage was 444X.
Figure 9—source data 2. Nearest annotated gene with treatment-specific divergence.
Nearest annotated gene to each loci with treatment specific divergence (loss of heterozygosity permutation test) with P<0.1 and FST = 0.3–0.5.
Figure 9—source data 3. Nearest annotated gene with punitive de novo singleton mutation.
Nearest annotated gene to each putative de novo singleton mutation.

Figure 9.

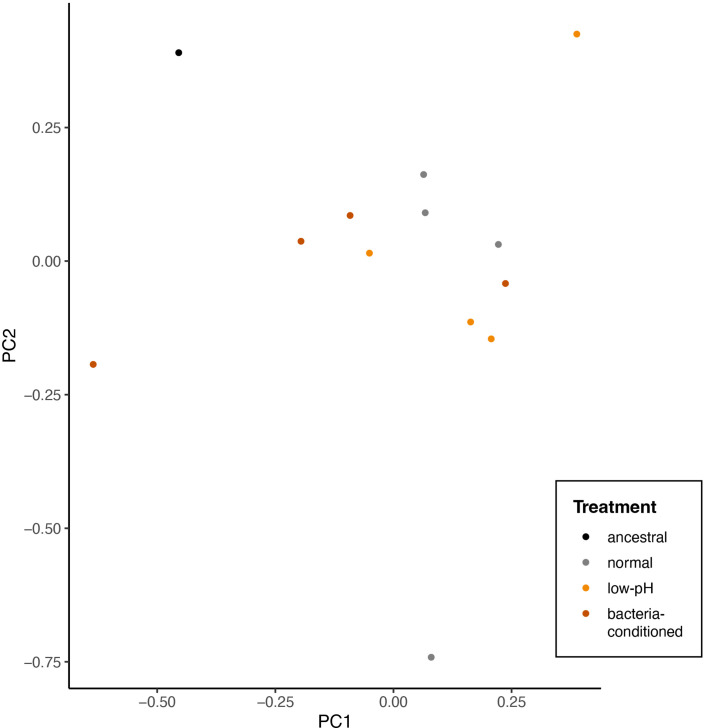
Figure 9—figure supplement 1. Principal components analysis of single nucleotide polymorphisms that differ between evolved and any ancestral strain (2319 sites).

Figure 9—figure supplement 1.

Points represent individual end-point clones (individuals) and are colored by evolution treatment (ancestral in black, neutral in grey, evolved in low-pH nectar in orange, and evolved in bacteria-conditioned nectar in dark red) (perMANOVA, p=0.19, n=12).
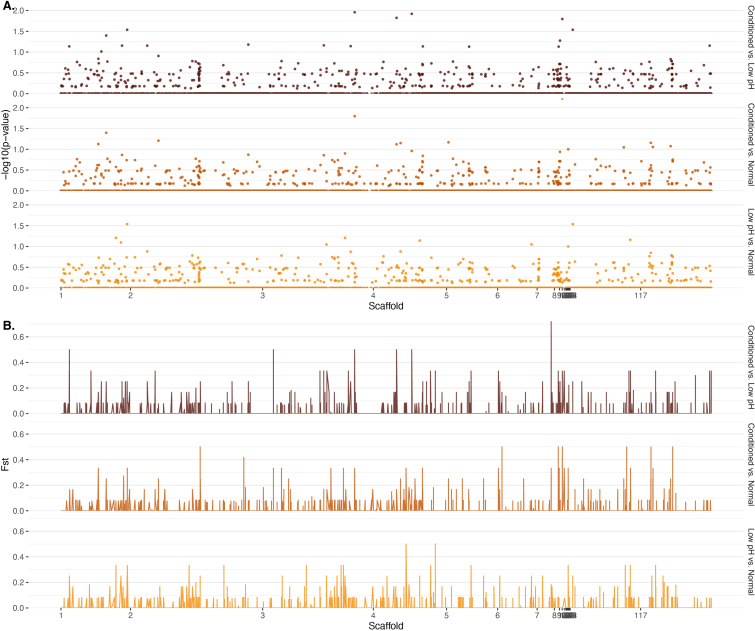
Figure 9—figure supplement 2. Genome-wide differentiation by (A) computed p-values for observed patterns of loss of heterozygosity (LOH) and (B) Weir-Cockerham estimator of FST.

Figure 9—figure supplement 2.