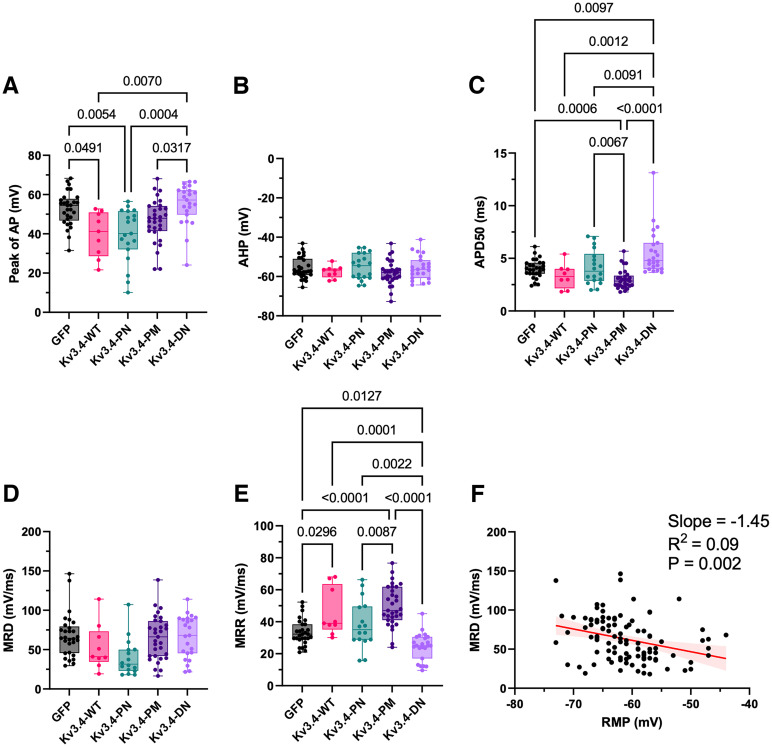
Figure 6.
Action potential properties following manipulations of the expression and effective phosphorylation status of Kv3.4 in DRG neurons. A–E, Scatter and box plots of the AP peak amplitude, AHP, APD50, MRD, and MRR, as indicated by the y-axis of the graph. The features of the box plots are as described in Figure 3. F, Correlation between MRD and RMP. The red solid line is the best-fit linear regression with the parameters (slope, R2 and P) indicated on the graph, and the shaded area represents the confidence limits of the regression. A similar weak correlation was found between MRR and RMP (slope = −0.13, R2 = 0.10, and p = 0.0007).

