
Figure 7.
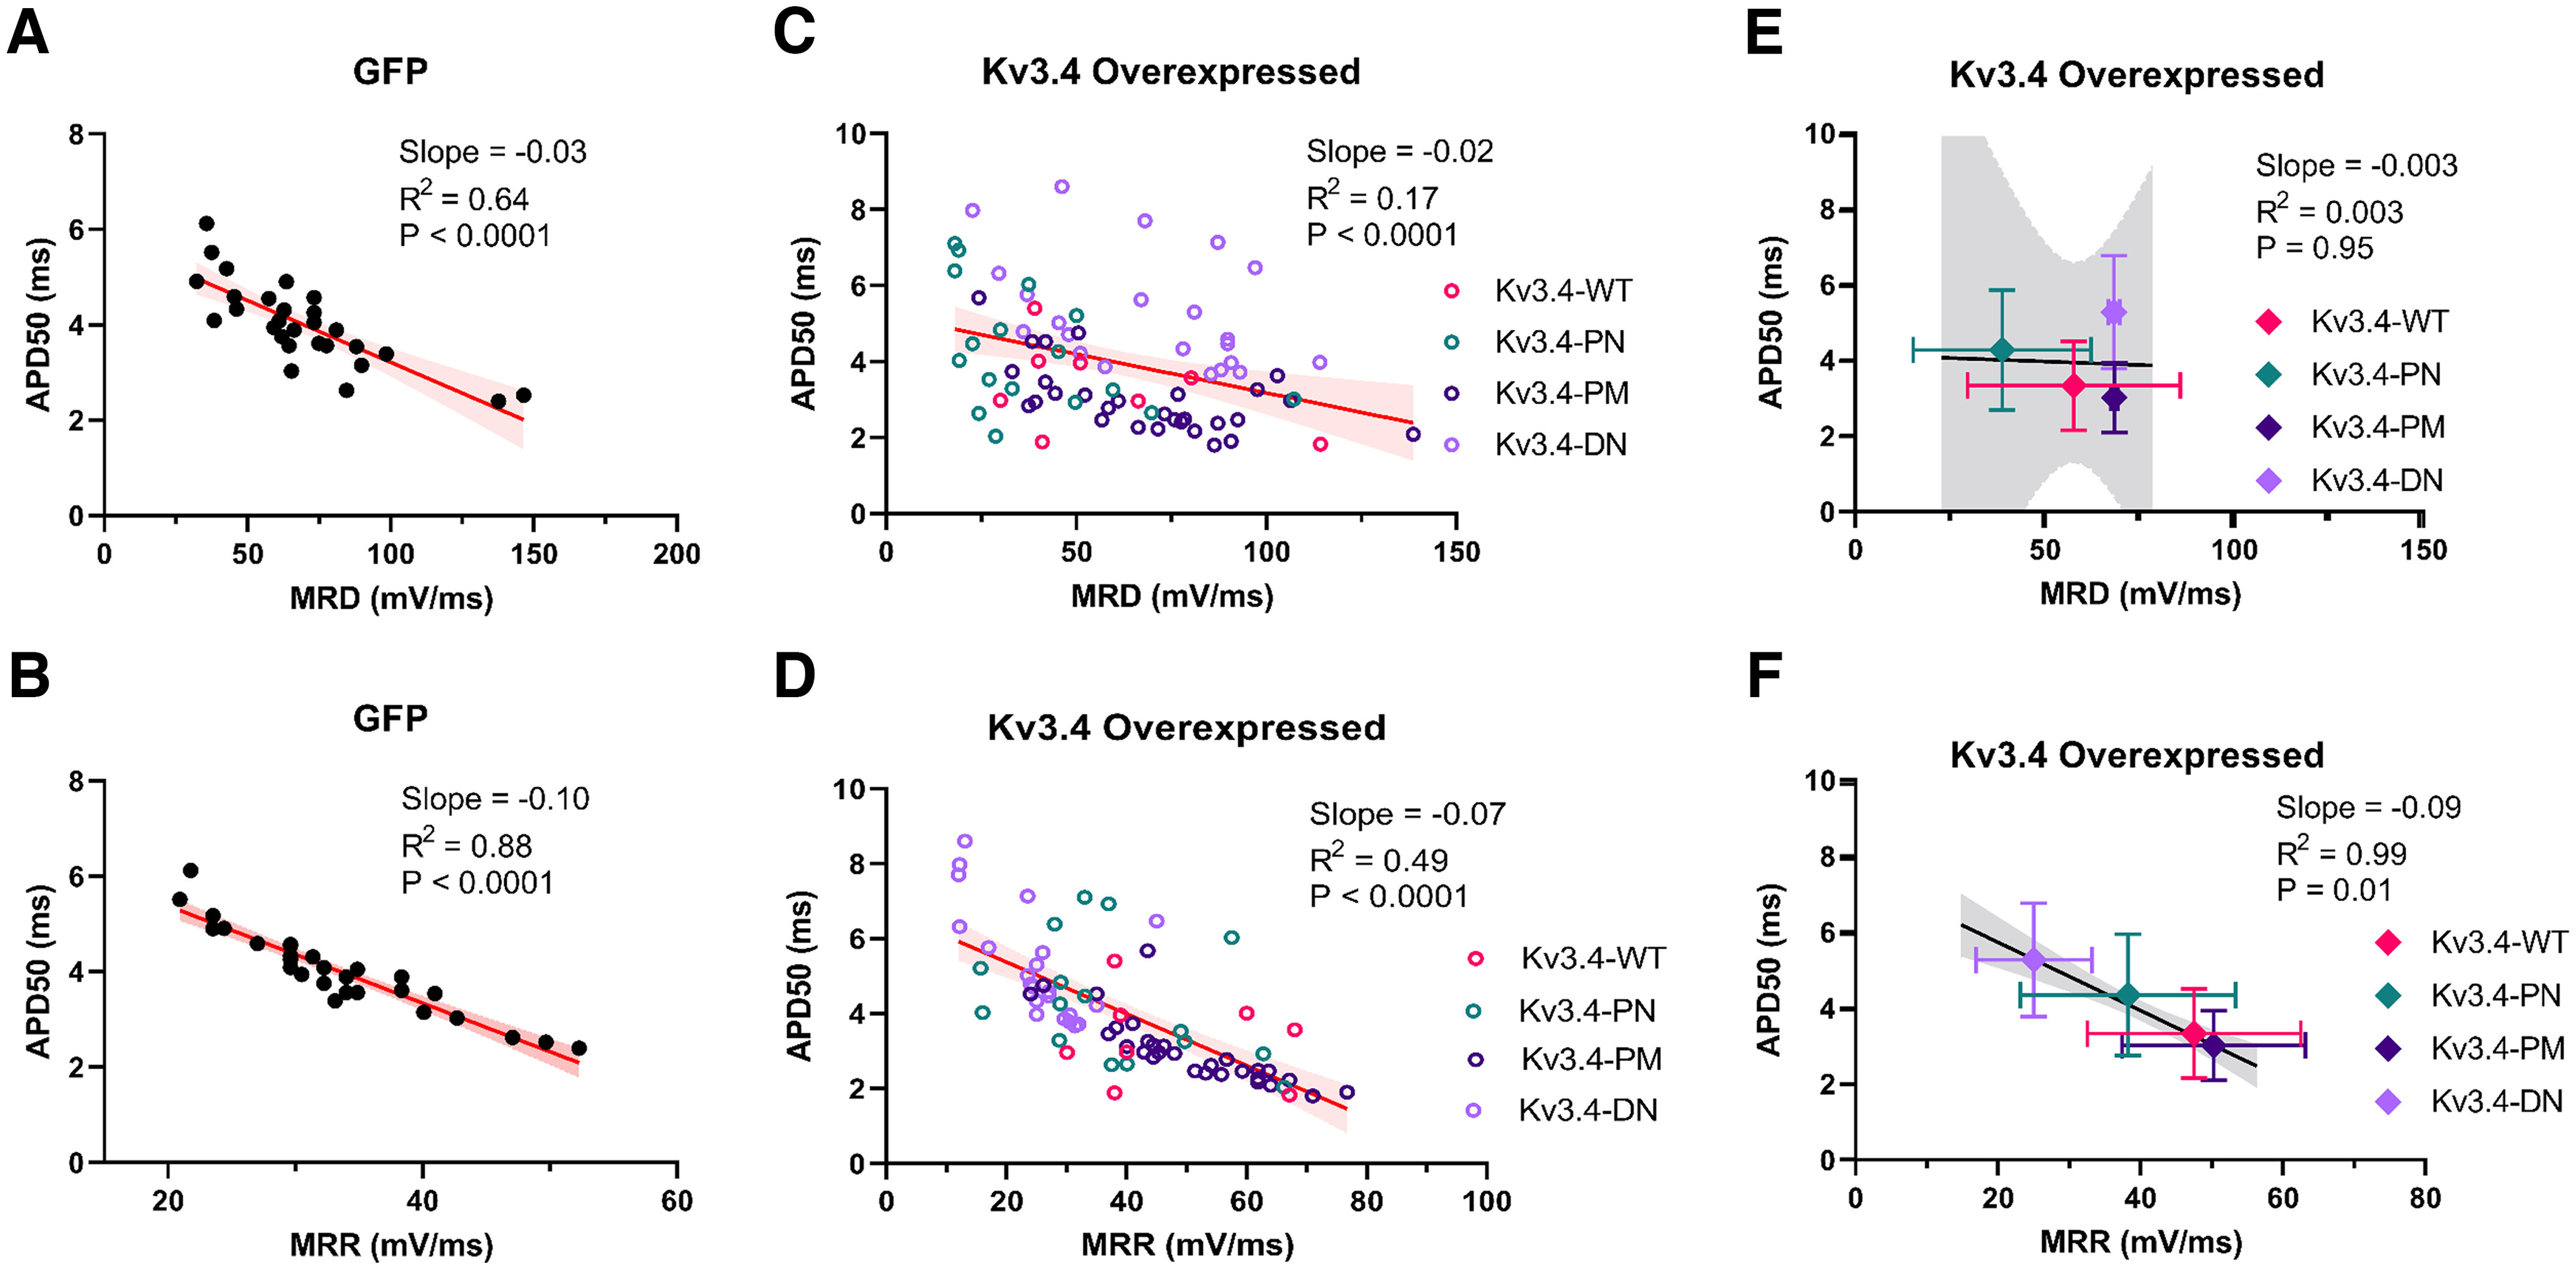
Correlations between action potential properties under conditions that manipulate Kv3.4 expression and effective phosphorylation status in DRG neurons. A, B, Correlations between APD50 and MRD, and between APD50 and MRR, respectively, from the control GFP group only. C, D, Global correlations of APD50 versus MRD and APD50 versus MRR, respectively, from all groups overexpressing Kv3.4 subunits (Kv3.4-WT, Kv3.4-PN, Kv3.4-PM, and Kv3.4-DN). In all graphs, the solid lines are the best-fit linear regressions with the parameters (slope, R2 and P) indicated on each graph. The shaded areas represent the confidence limits of the regressions. E, F, Correlations of mean APD50 versus mean MRD and mean APD50 versus mean MRR, respectively.