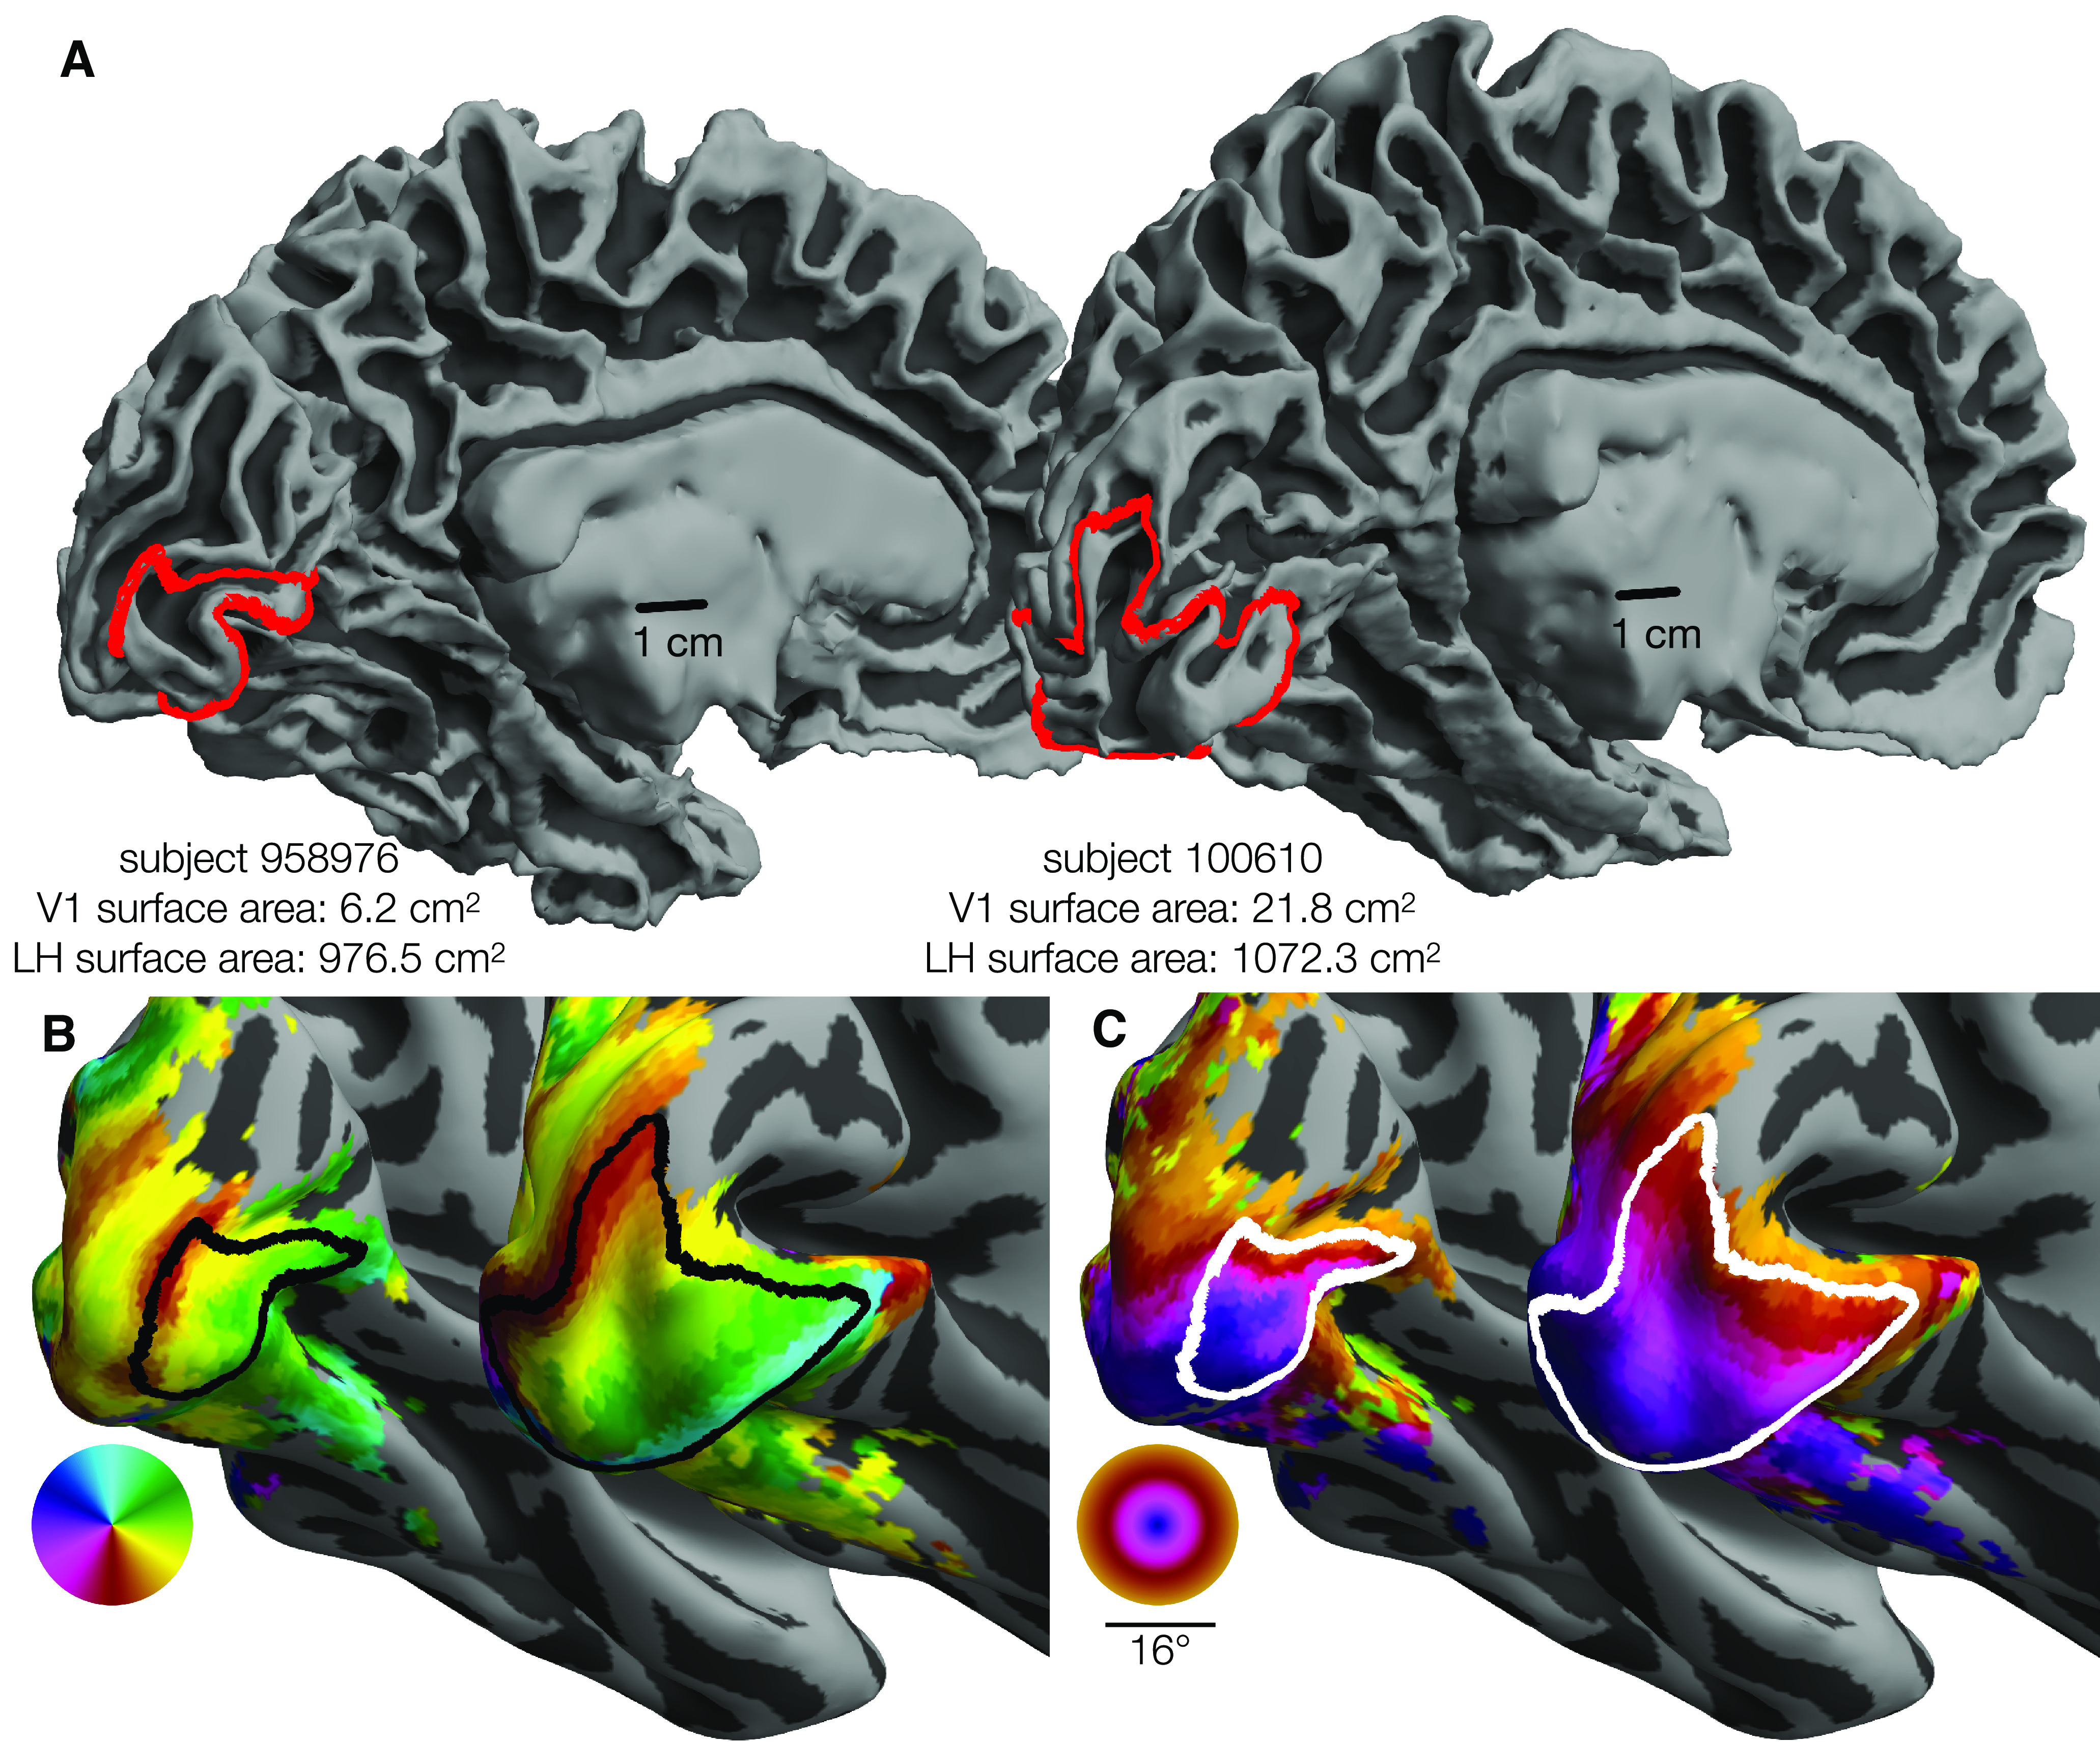
Figure 1.

Variability in V1 size. The surface area of V1 (0°-7°) differs by 3.5× between 2 individuals. Each panel represents the smallest and the largest LH V1 by surface area from the HCP 7T Retinotopy Dataset. In each panel, both hemispheres are rendered at the same scale. A, White matter surfaces, with the red line indicating the V1 boundary (0°-7° eccentricity). Identical 1 cm scale bars are plotted at similar positions relative to each hemisphere. B, Inflated surfaces colored by polar angle; black lines indicate the V1 boundary. C, Inflated surfaces colored by visual eccentricity; white lines indicate the V1 boundary. Red, black, and white V1 boundaries are equivalent: Colors were chosen to improve contrast. Orthographic projections of these surfaces and boundaries that better show the context of the boundaries can be found in the project's OSF repository in the “images/raw_lines” folder (see Materials and Methods).
