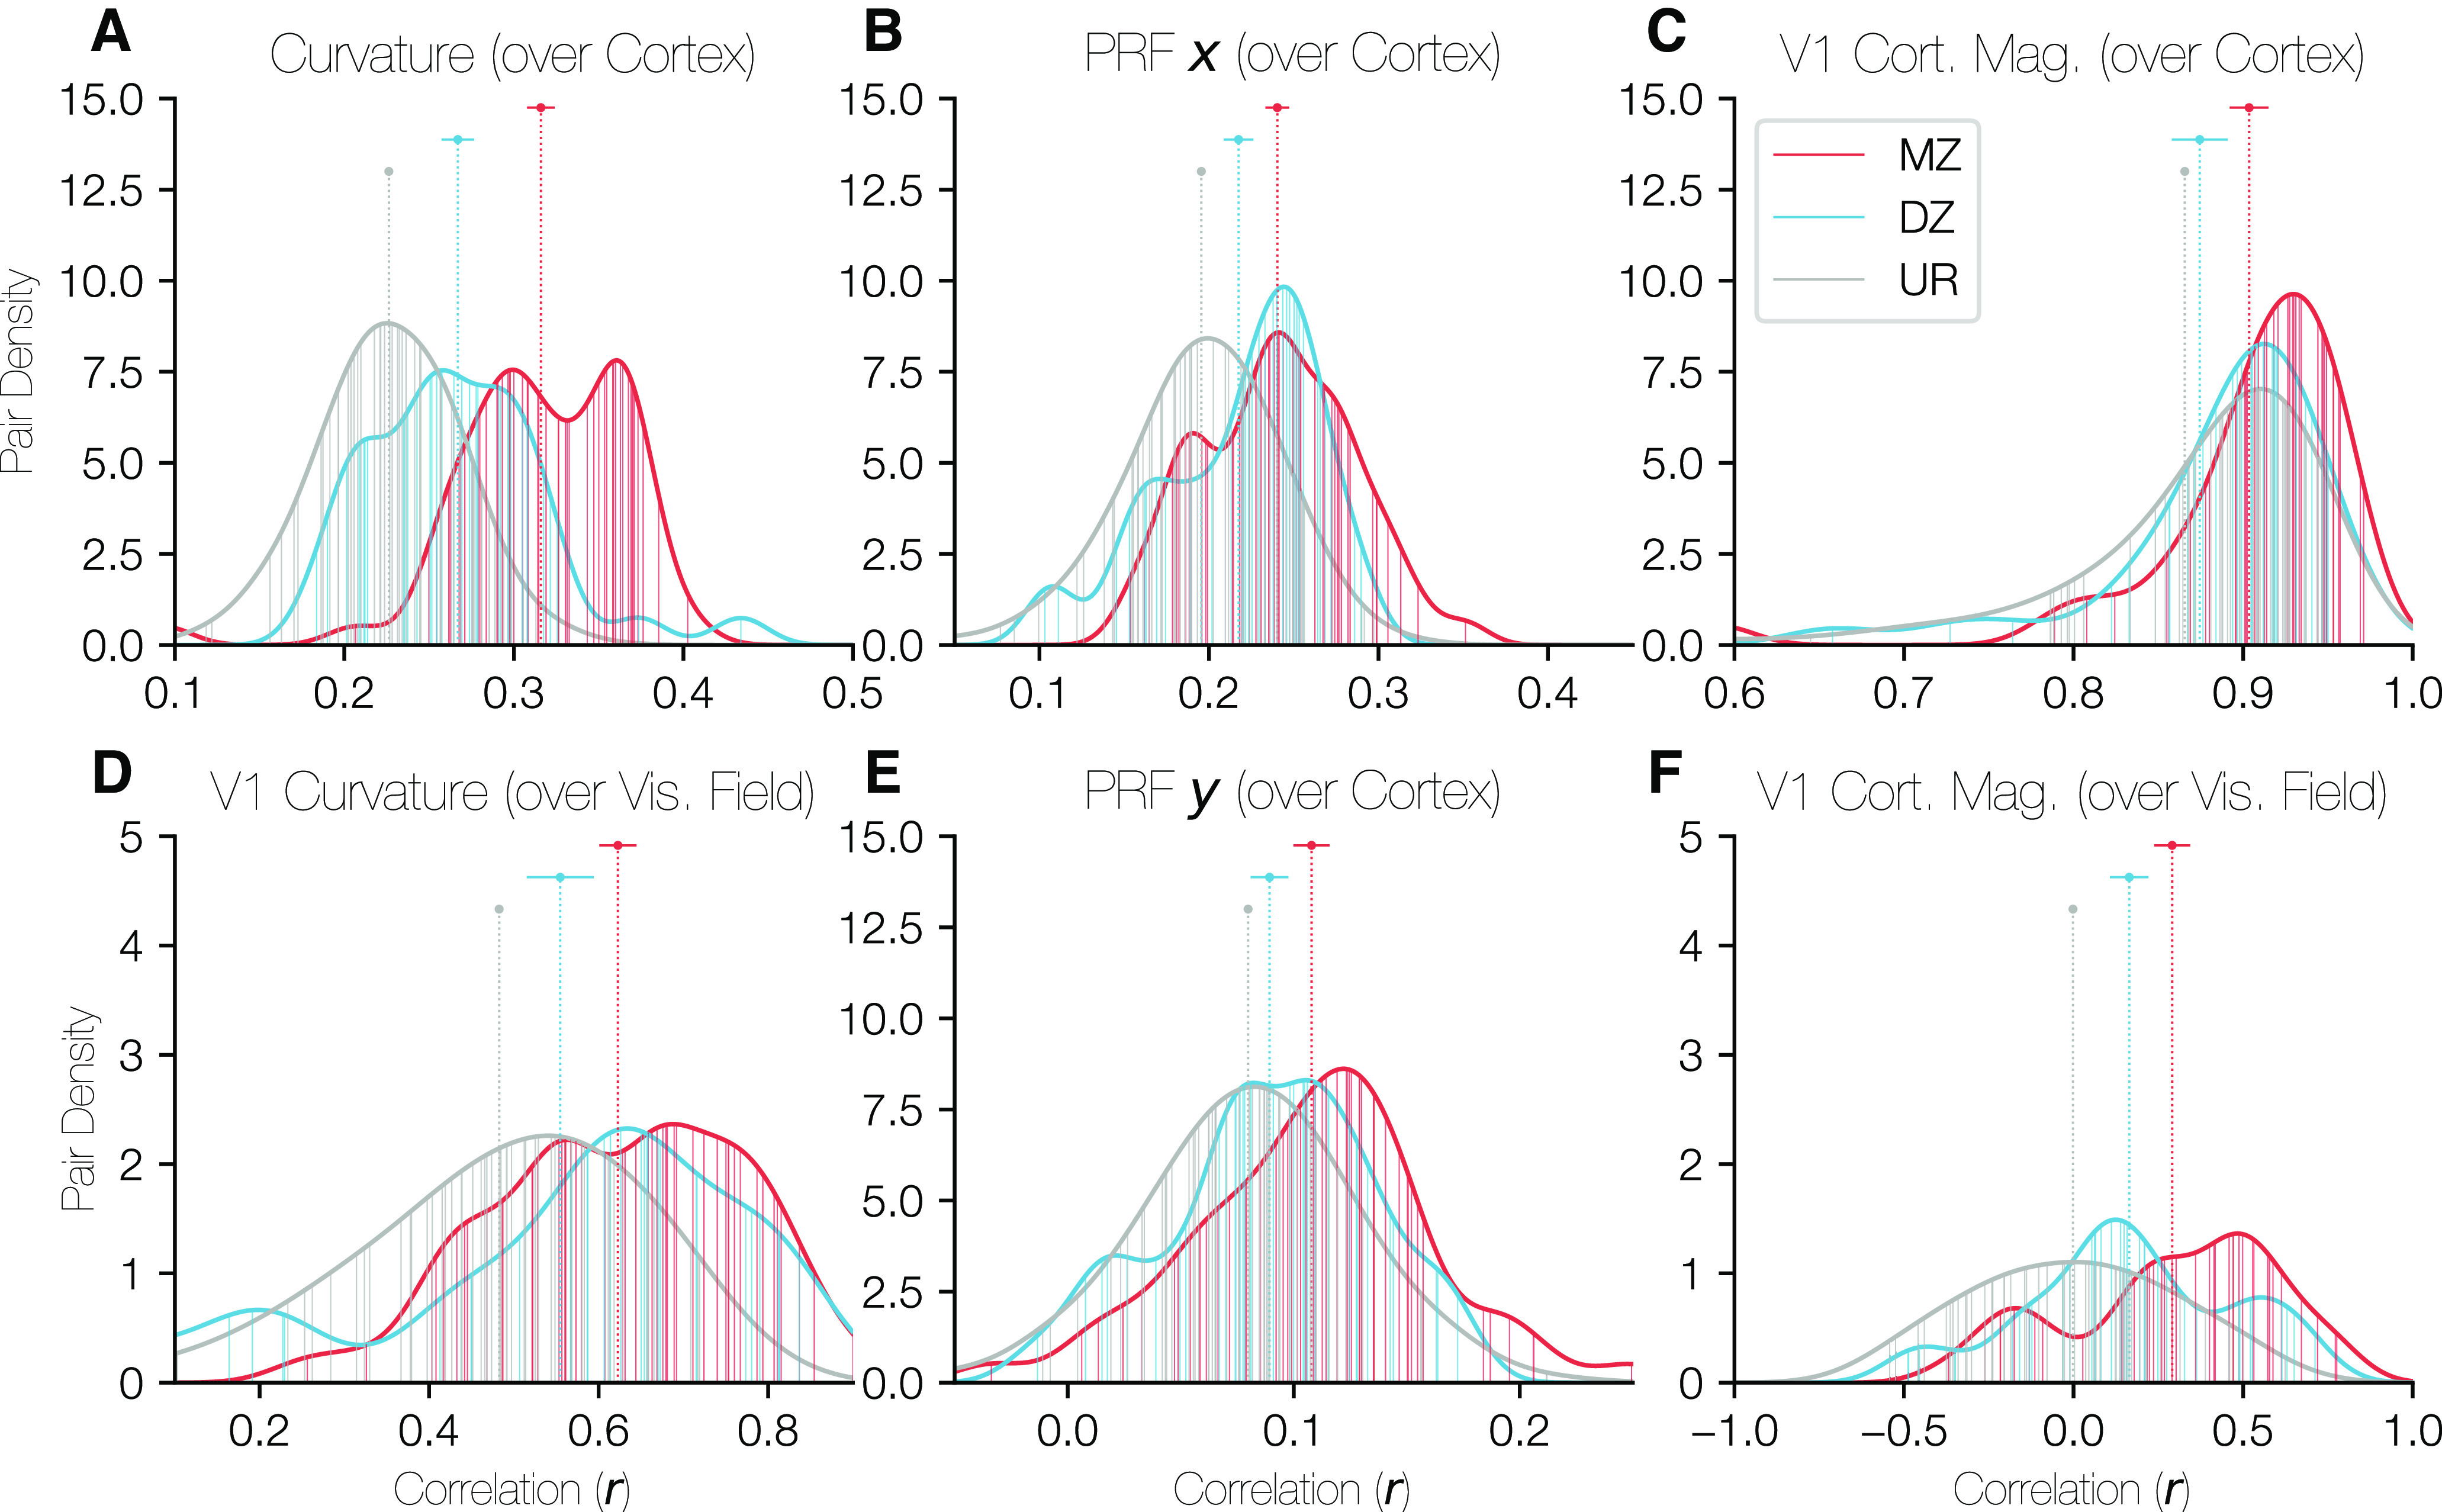
Figure 10.

Distributions of correlations of cortical properties between twin pairs. In each panel, the density of correlation values is plotted for all three relationship types (MZ, DZ, UR [unrelated]) with the x axis corresponding to the correlation value of the relevant property over the occipital cortical surface and the y axis corresponding to the density of twin pairs at that correlation value. The ROI over which the correlation was calculated was identical for A, B, and E. This region was defined on the HCP's fs_LR anatomically aligned surface and consisted of a circular region of cortex just large enough to contain V1, V2, and V3 for all subjects. C, Restricted to V1 only. D, F, Restricted to V1, but correlations were calculated over the visual field rather than over the cortical surface. The points and error-bars at the top of the panels give the median and the 68% CI of the correlation values for each relationship type. In all cases, the URs are so numerous that the CI is narrower than the plot point. Vertical lines plotted from the x axis to the histogram boundary indicate the individual twin pairs for MZ and DZ groups. For the URs, the lines are too numerous to plot, so a random sample of 50 URs are shown; however, the UR histograms are calculated using all URs.
