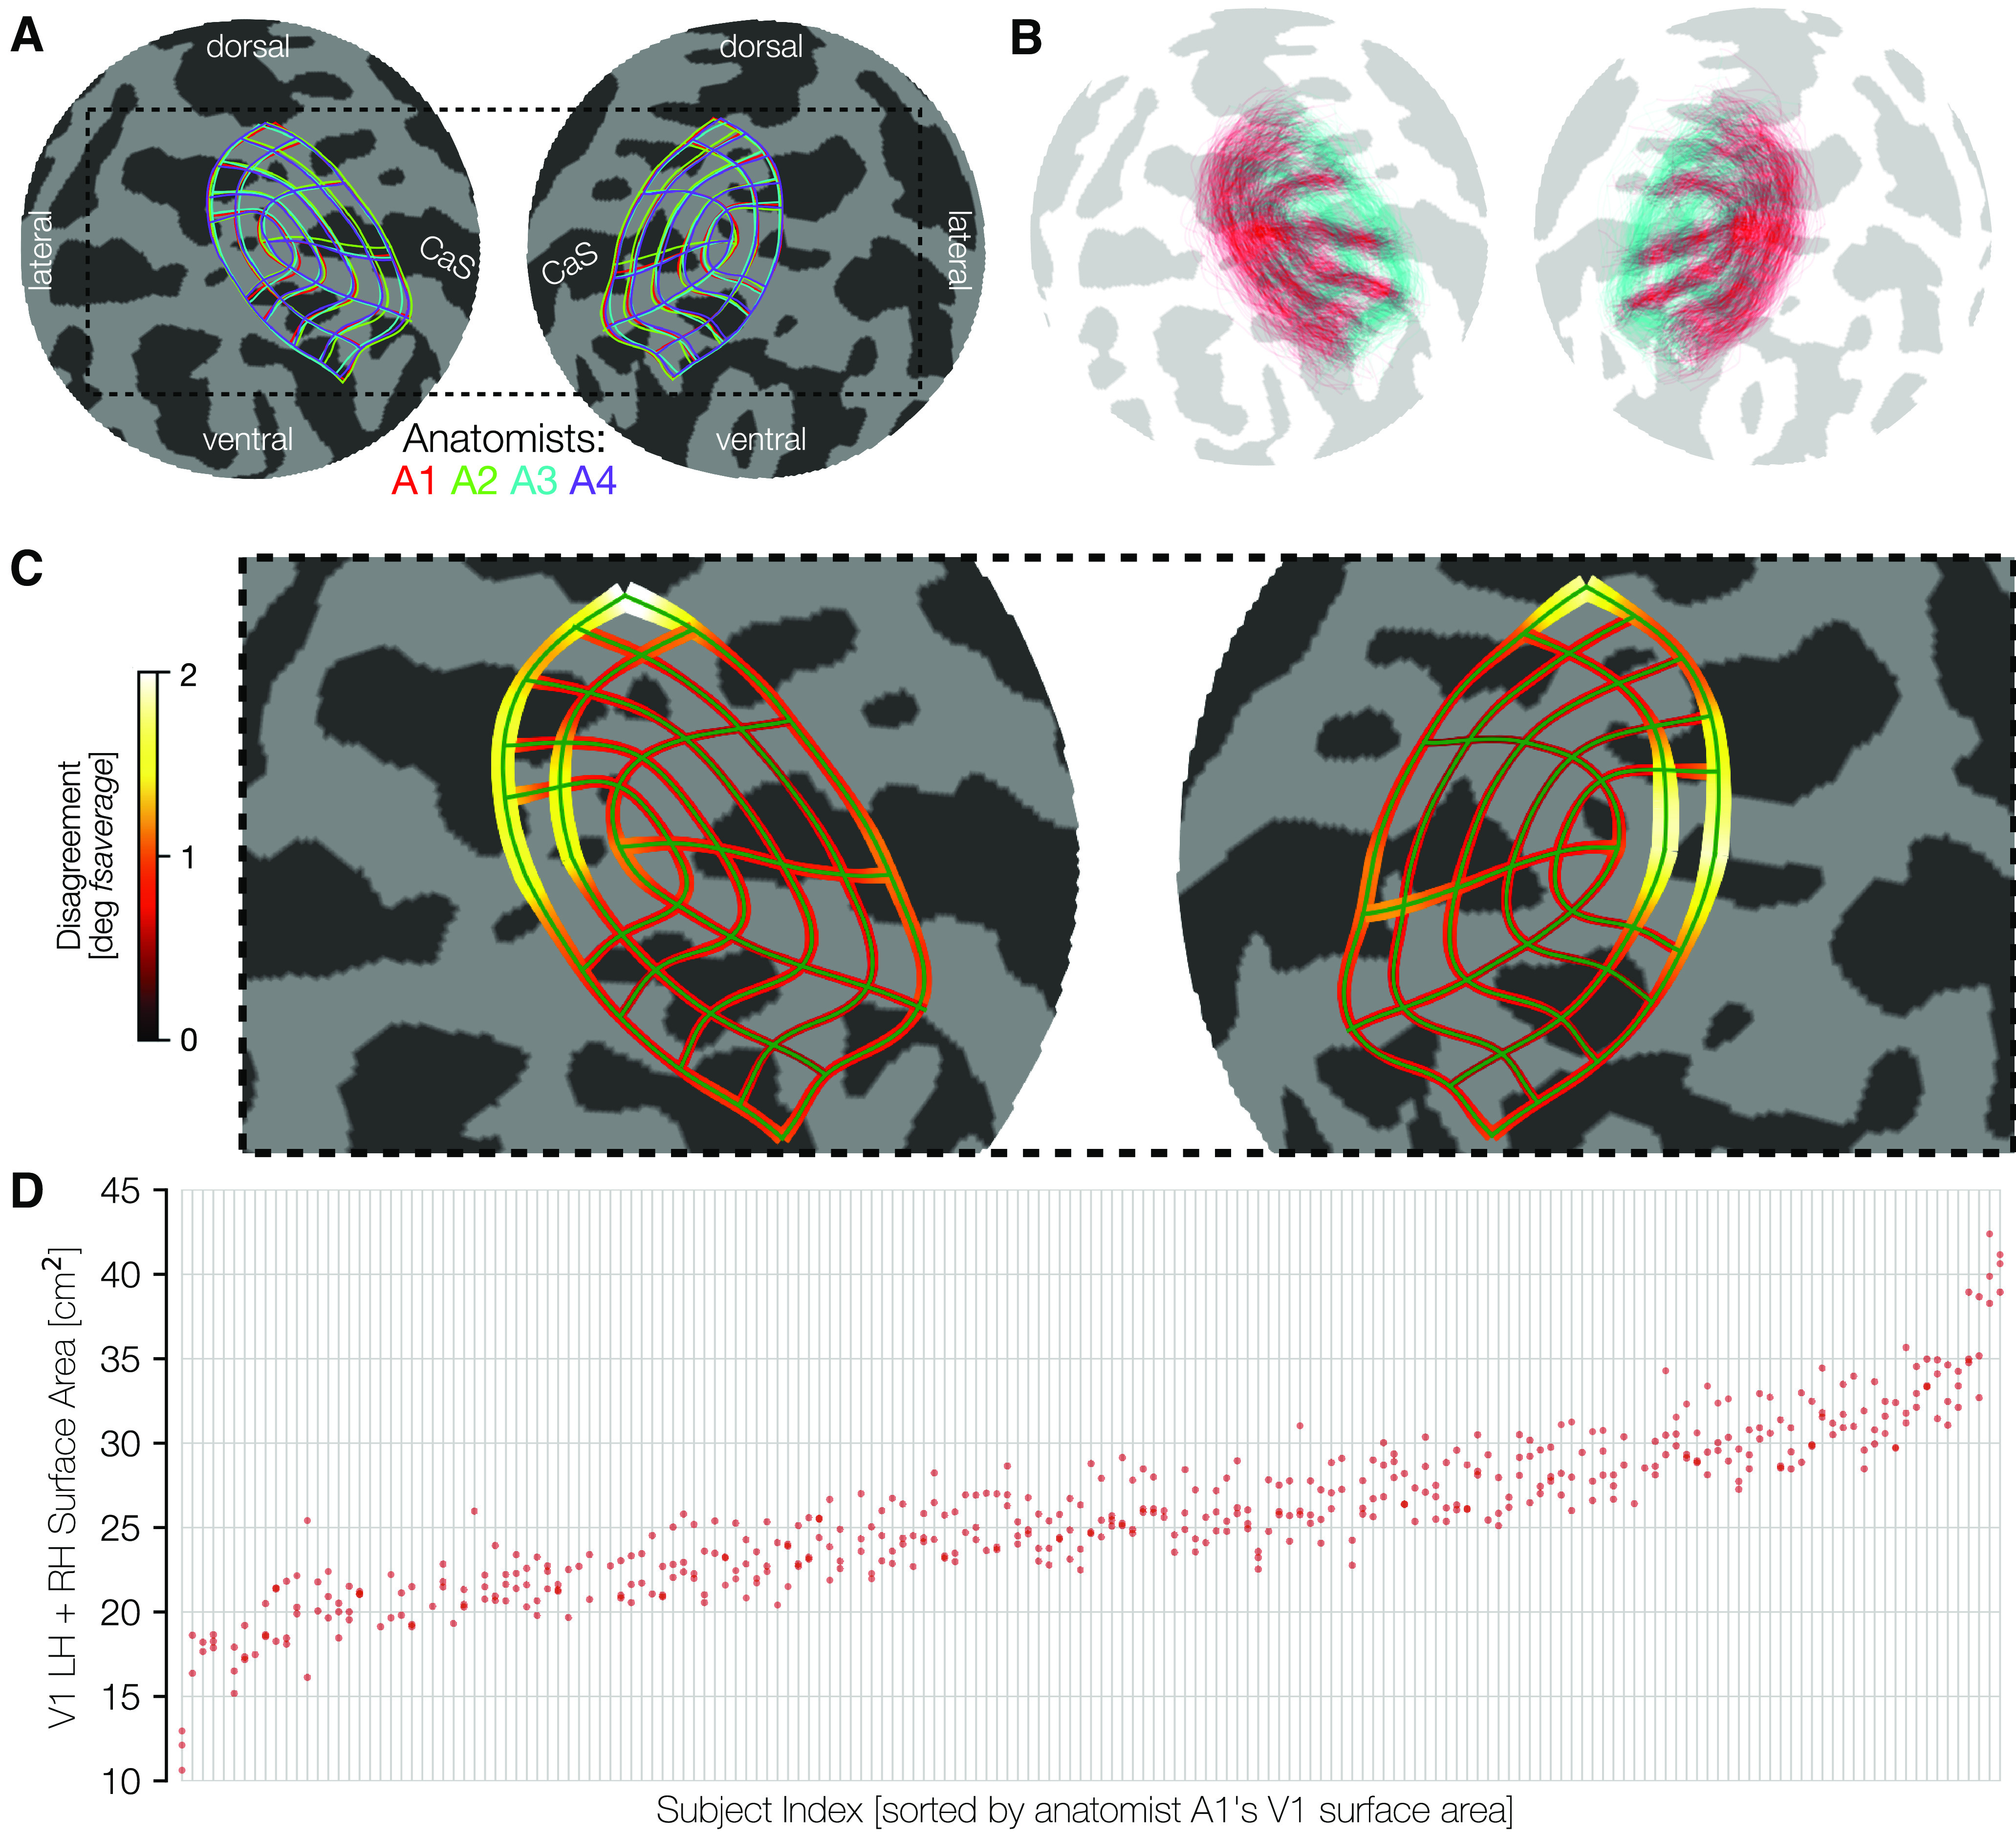
Figure 4.

Consistency among anatomists and variability across subjects. A, The mean manually defined retinotopic grid (averaged across subjects) for each anatomist. Line thickness indicates ±σ across subjects for each anatomist. Plots use an orthographic projection of the fsaverage sphere centered at the occipital pole (CaS, Calcarine sulcus). B, The converse of A: contours are averaged across the 4 anatomists, and plotted separately for each individual subject. For better visibility, we plot only a subset of the iso-eccentricity contours (0.5°, 2°, 7°, colored cyan) and all 7 iso-polar angle contours (red). The variability across these retinotopic grid demonstrates intersubject variability, even after warping to the fsaverage template. C, The magnitude of disagreement between anatomists is plotted at each point along an iso-eccentricity or iso-polar angle contour. Both the width of the contours and the color plot the mean over subjects of the disagreement between anatomists in degrees of the fsaverage spherical mesh. D, Surface area is plotted on the y axis and individual subjects (light gray vertical lines) are ordered across the x axis by sorting on A1 surface area. For each subject, the clustering is fairly tight for the 4 anatomists' surface areas (red dots), and the spread between anatomists is much smaller than the magnitude of differences between subjects.
