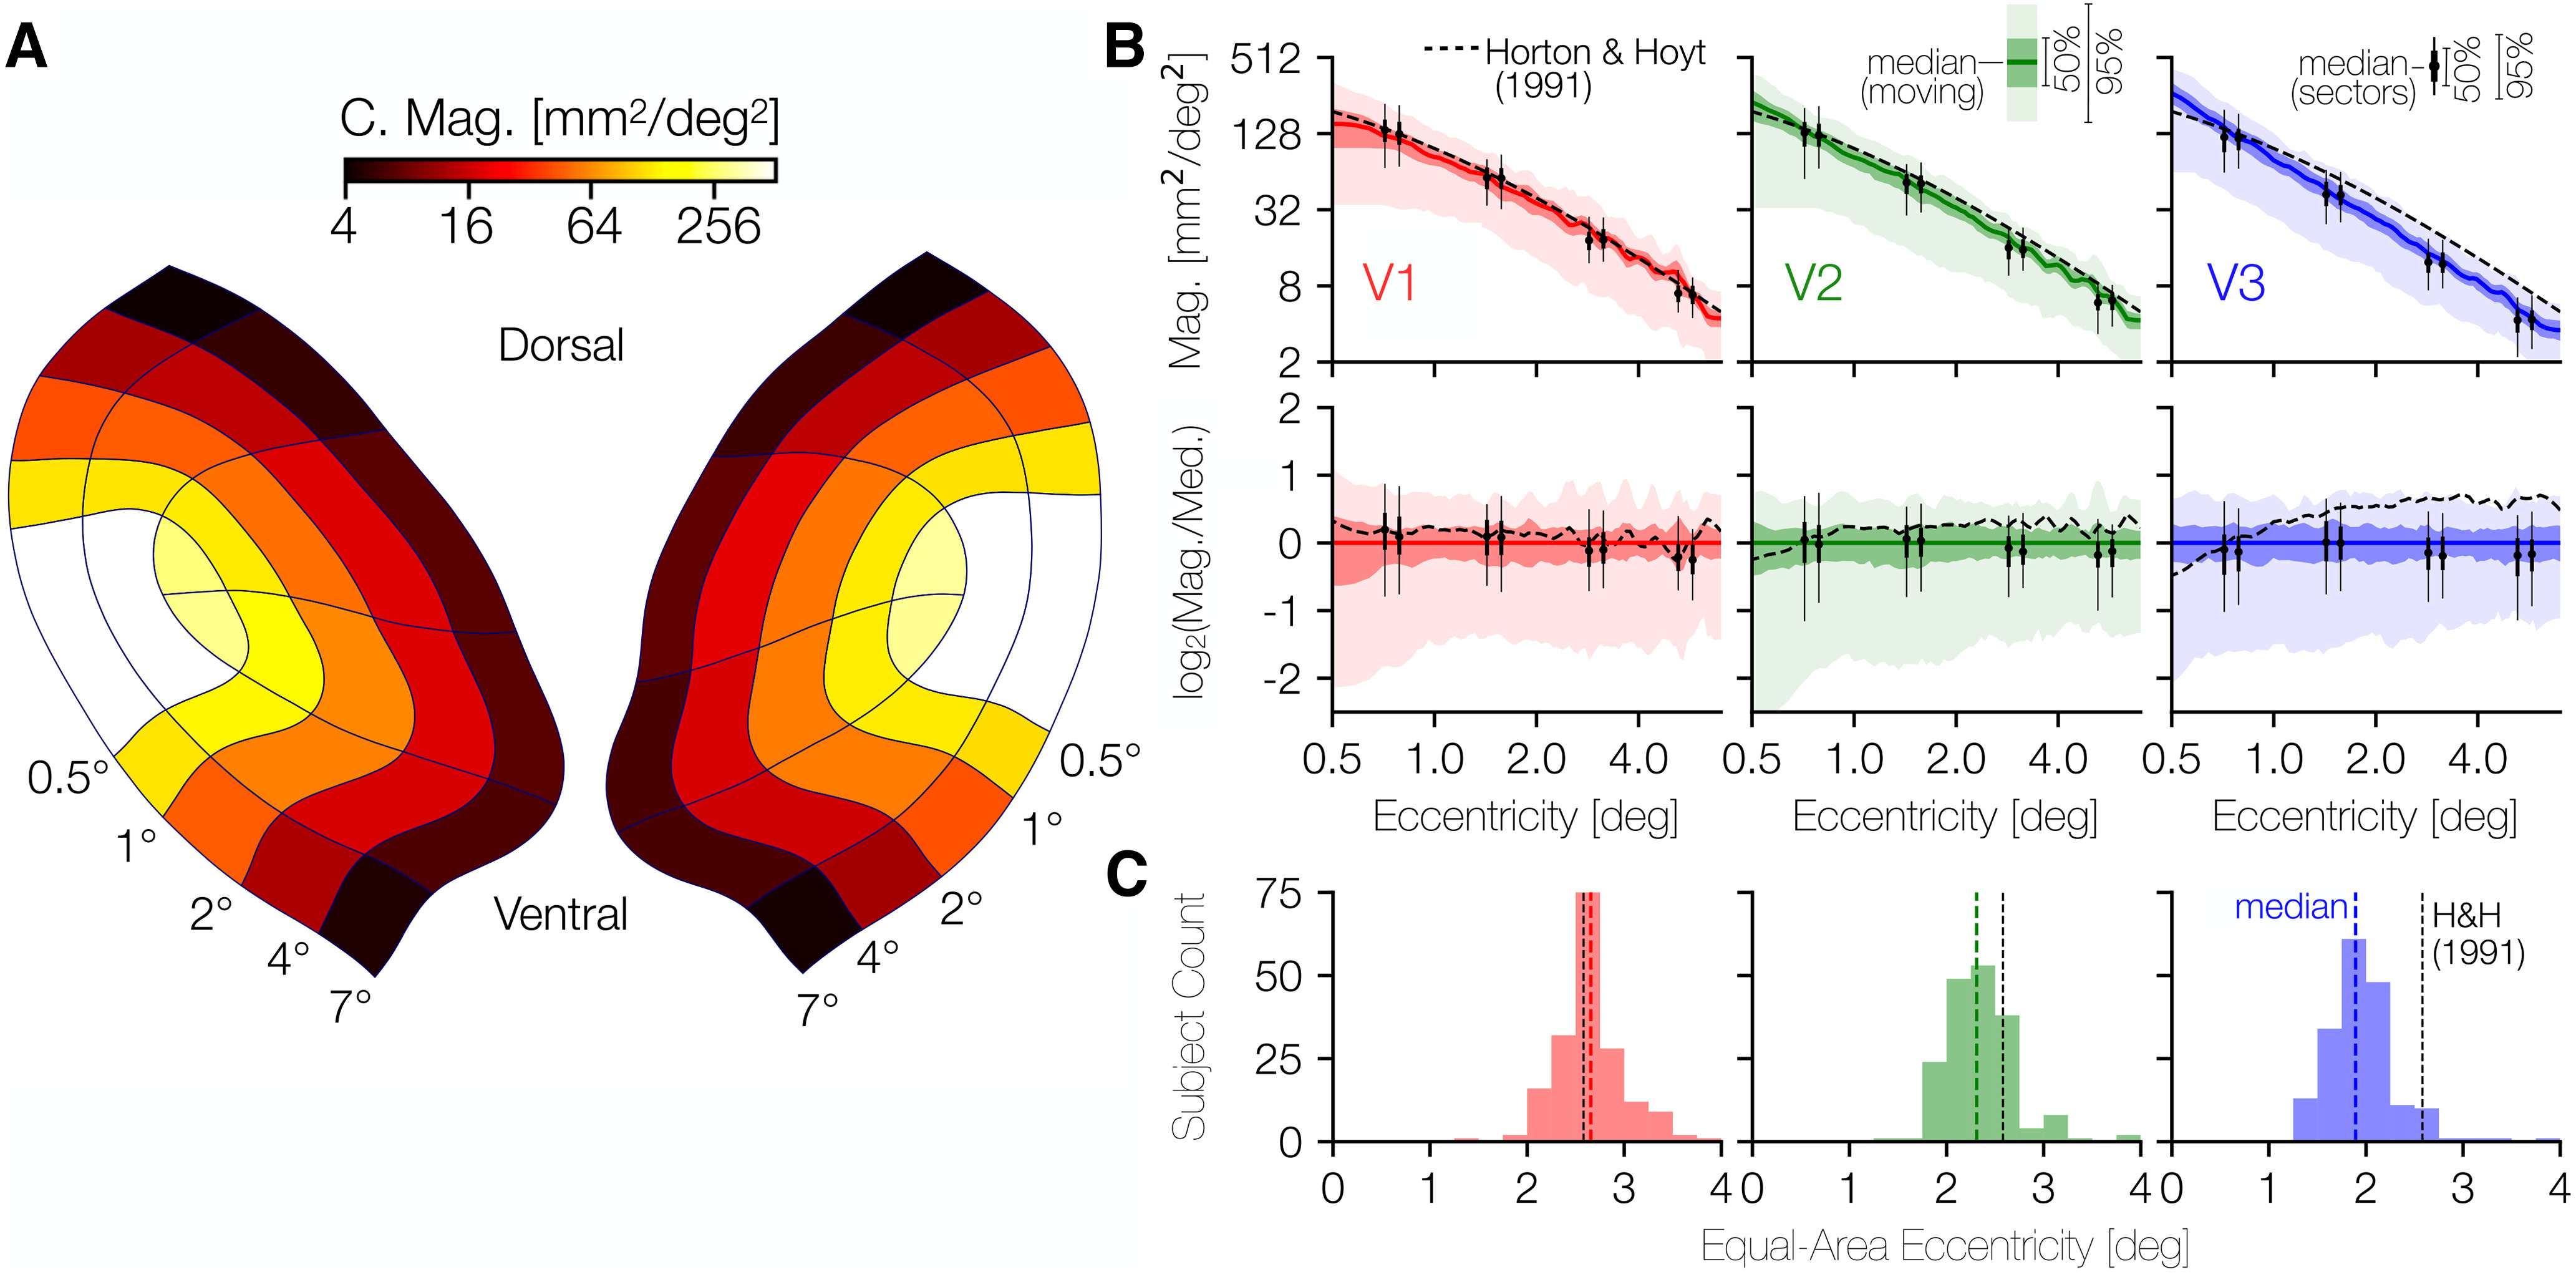
Figure 6.

Cortical magnification in V1, V2, and V3. A, Average areal cortical magnification of each sector of V1-V3 across subjects; the mean set of contours across anatomists for each subject was used to calculate the cortical surface area of each sector. B, Median areal cortical magnification across subjects in terms of eccentricity. In both top and bottom rows, solid-colored lines indicate the median, whereas the darker and lighter shaded regions represent the 25%/75% and 2.5%/97.5% percentiles. Black dashed line indicates the cortical magnification function for V1 reported by Horton and Hoyt (1991). In the top row of panels, the cortical magnification is plotted. In the bottom row, the same data are reproduced but are plotted in terms of their relation to the median. A point (xtop,ytop) from the top row is plotted in the bottom row as (xbot,ybot) where xbot = xtop, but with ybot = log2(y/m(x)) where m(x) is the median cortical magnification at eccentricity x. A consequence of this scaling is that the median line in the top row is plotted as a constant y = 0 in the bottom row. C, Histograms of the eccentricity that divides the surface area of the inner 7° of V1, V2, or V3 into equal foveal and peripheral halves. Black dotted line indicates the eccentricity at which this would occur according to Horton and Hoyt (1991): ∼2.58° of eccentricity. Explicitly, this means that, according to Horton and Hoyt, the V1 ROI from 0° to 2.58° of eccentricity has the same surface area as the V1 ROI from 2.58° to 7° of eccentricity.
