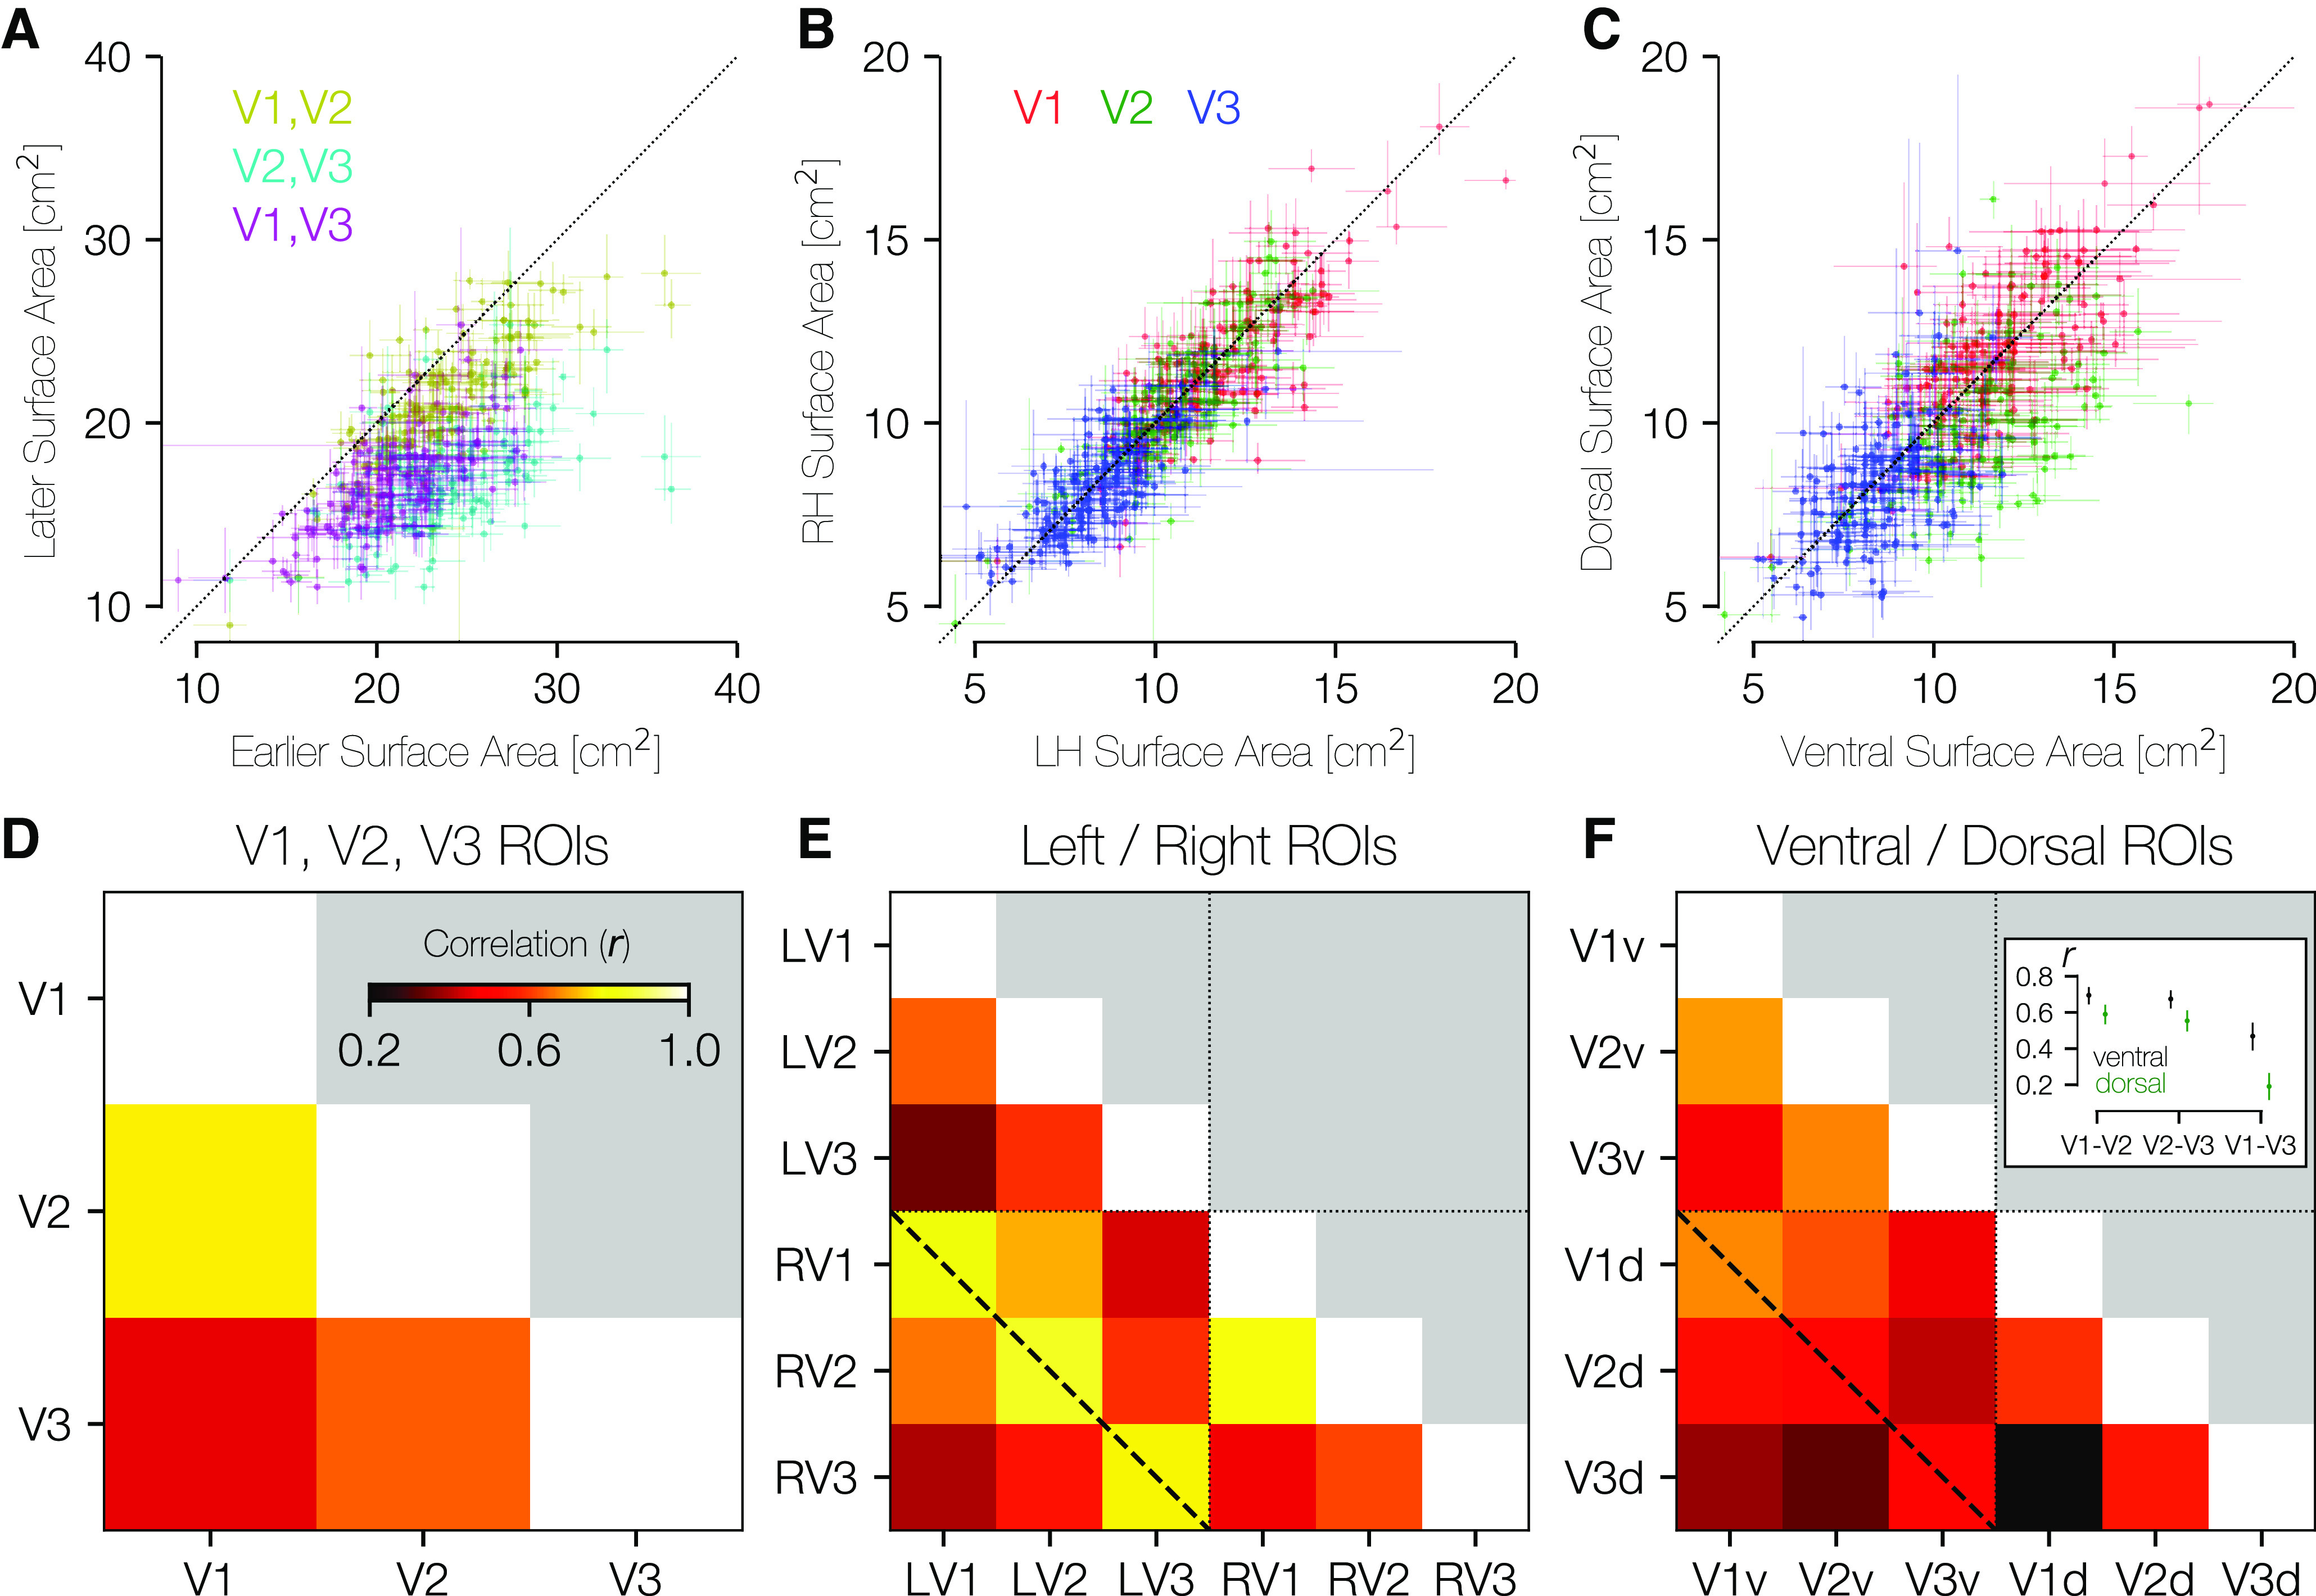
Figure 7.

Area-area correlations. A, In all three possible pairings of areas V1, V2, and V3, the earlier area tends to be larger than the later area (center of mass for all three colors lies below the lines of equality). Crosses about the plotted points indicate the range of values across anatomists. B, Within individuals, there is substantial LH-RH symmetry in the surface area of V1-V3. C, Within individuals, there is substantial dorsal-ventral symmetry in surface area. D, The correlation between areas V1 and V2 is higher than between areas V1 and V3 or areas V2 and V3. E, This correlation matrix includes LH/RH V1, V2, V3. Relatively higher correlation in surface areas can be seen within each area across hemispheres (e.g., LH V1 and RH V1; diagonal dotted line). F, This correlation matrix includes ventral/dorsal V1, V2, V3. The pattern of correlations in surface area is highest for V1v-V2v, V2v-V3v, and V1v-V1d. Inset, The median and 68% CIs for ventral and dorsal comparisons, as computed across 10,000 bootstraps. CIs are nonoverlapping for each comparison shown.
