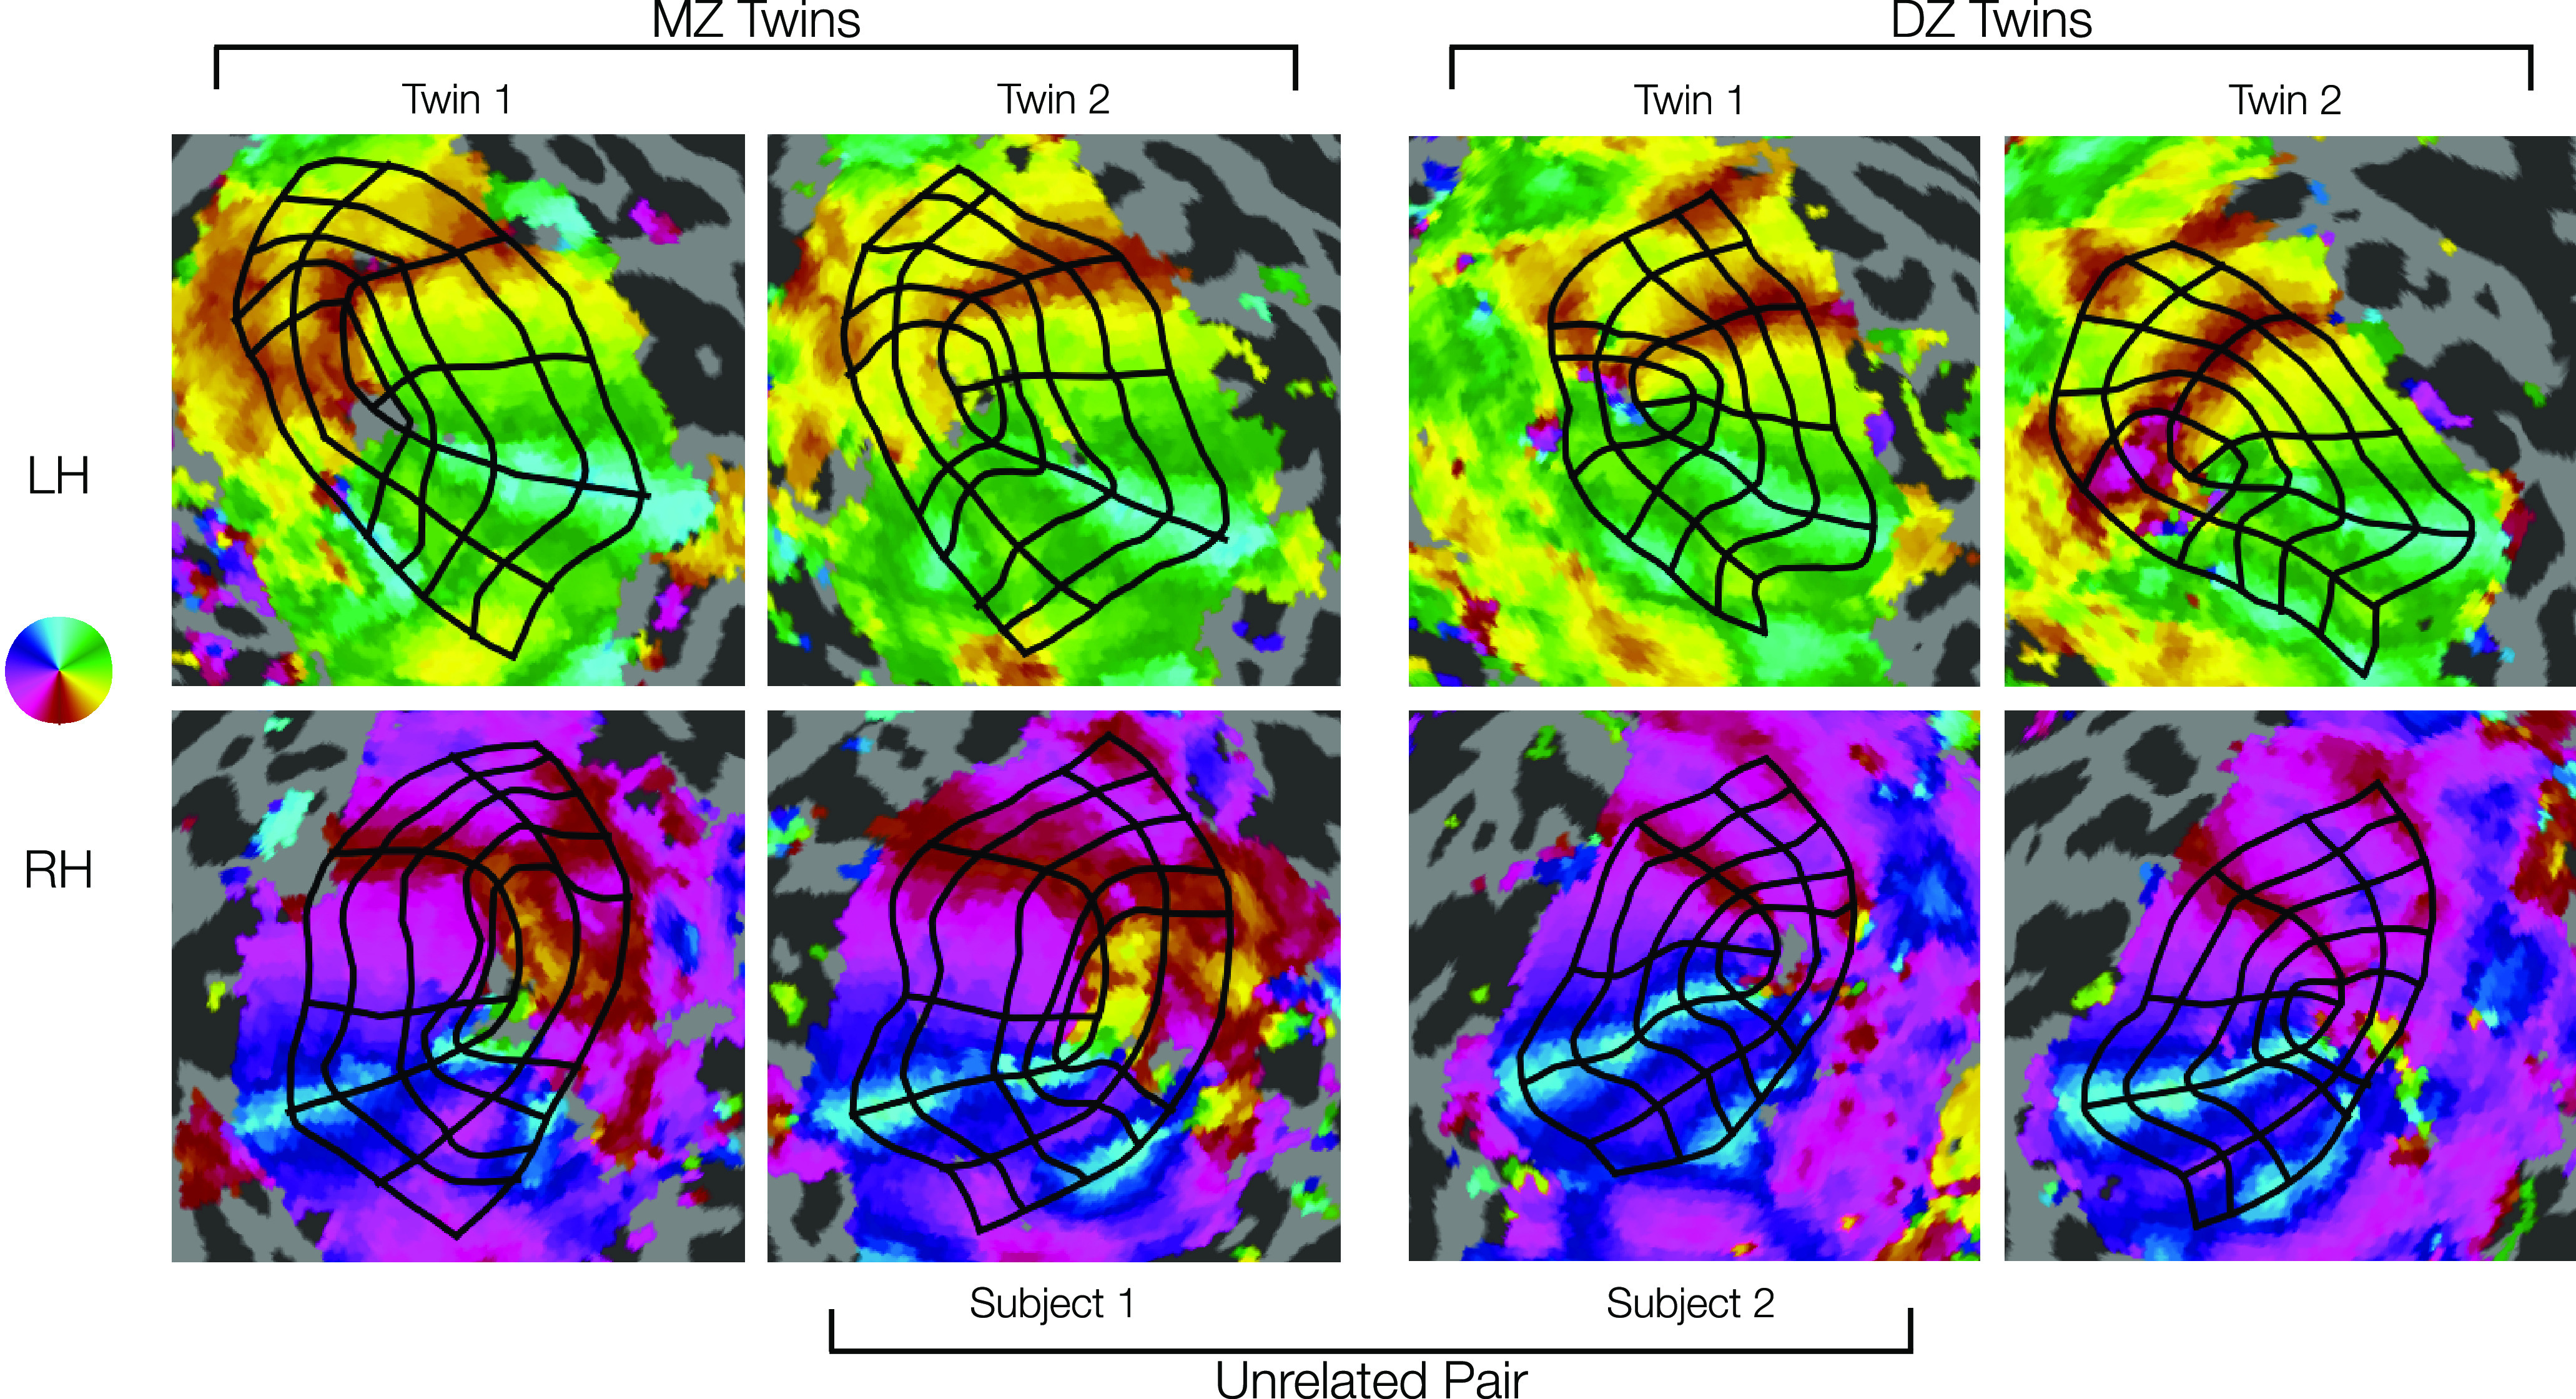
Figure 8.

Comparison of manually defined retinotopic grids in MZ twins, DZ twins, and a UR pair. Top row, LHs. Bottom row, RHs. Functional data from polar angle scans are depicted for each hemisphere (see color map). Black grids represent the 7 iso-polar angle contours (V1m, V1d, V1v, V2d, V2v, V3d, V3v) and 5 iso-eccentricity contours (0.5°, 1°, 2°, 4°, 7°) on each hemisphere (see Fig. 2A). Note the high similarity in the functional data and resulting grid in the MZ twins (left two columns), especially the RH V1's larger lower field (dorsal) representations. Intermediate similarity in the DZ twins (right two columns) can be seen in size, shape, and other details of the functional data and resulting grid. Lower similarity in the example a UR pair (inner two columns) can be seen in the functional data and resulting grids, especially in overall size. Visual inspection reveals much higher similarity in the topography of areas V1-V3 for the DZ and MZ twins.
