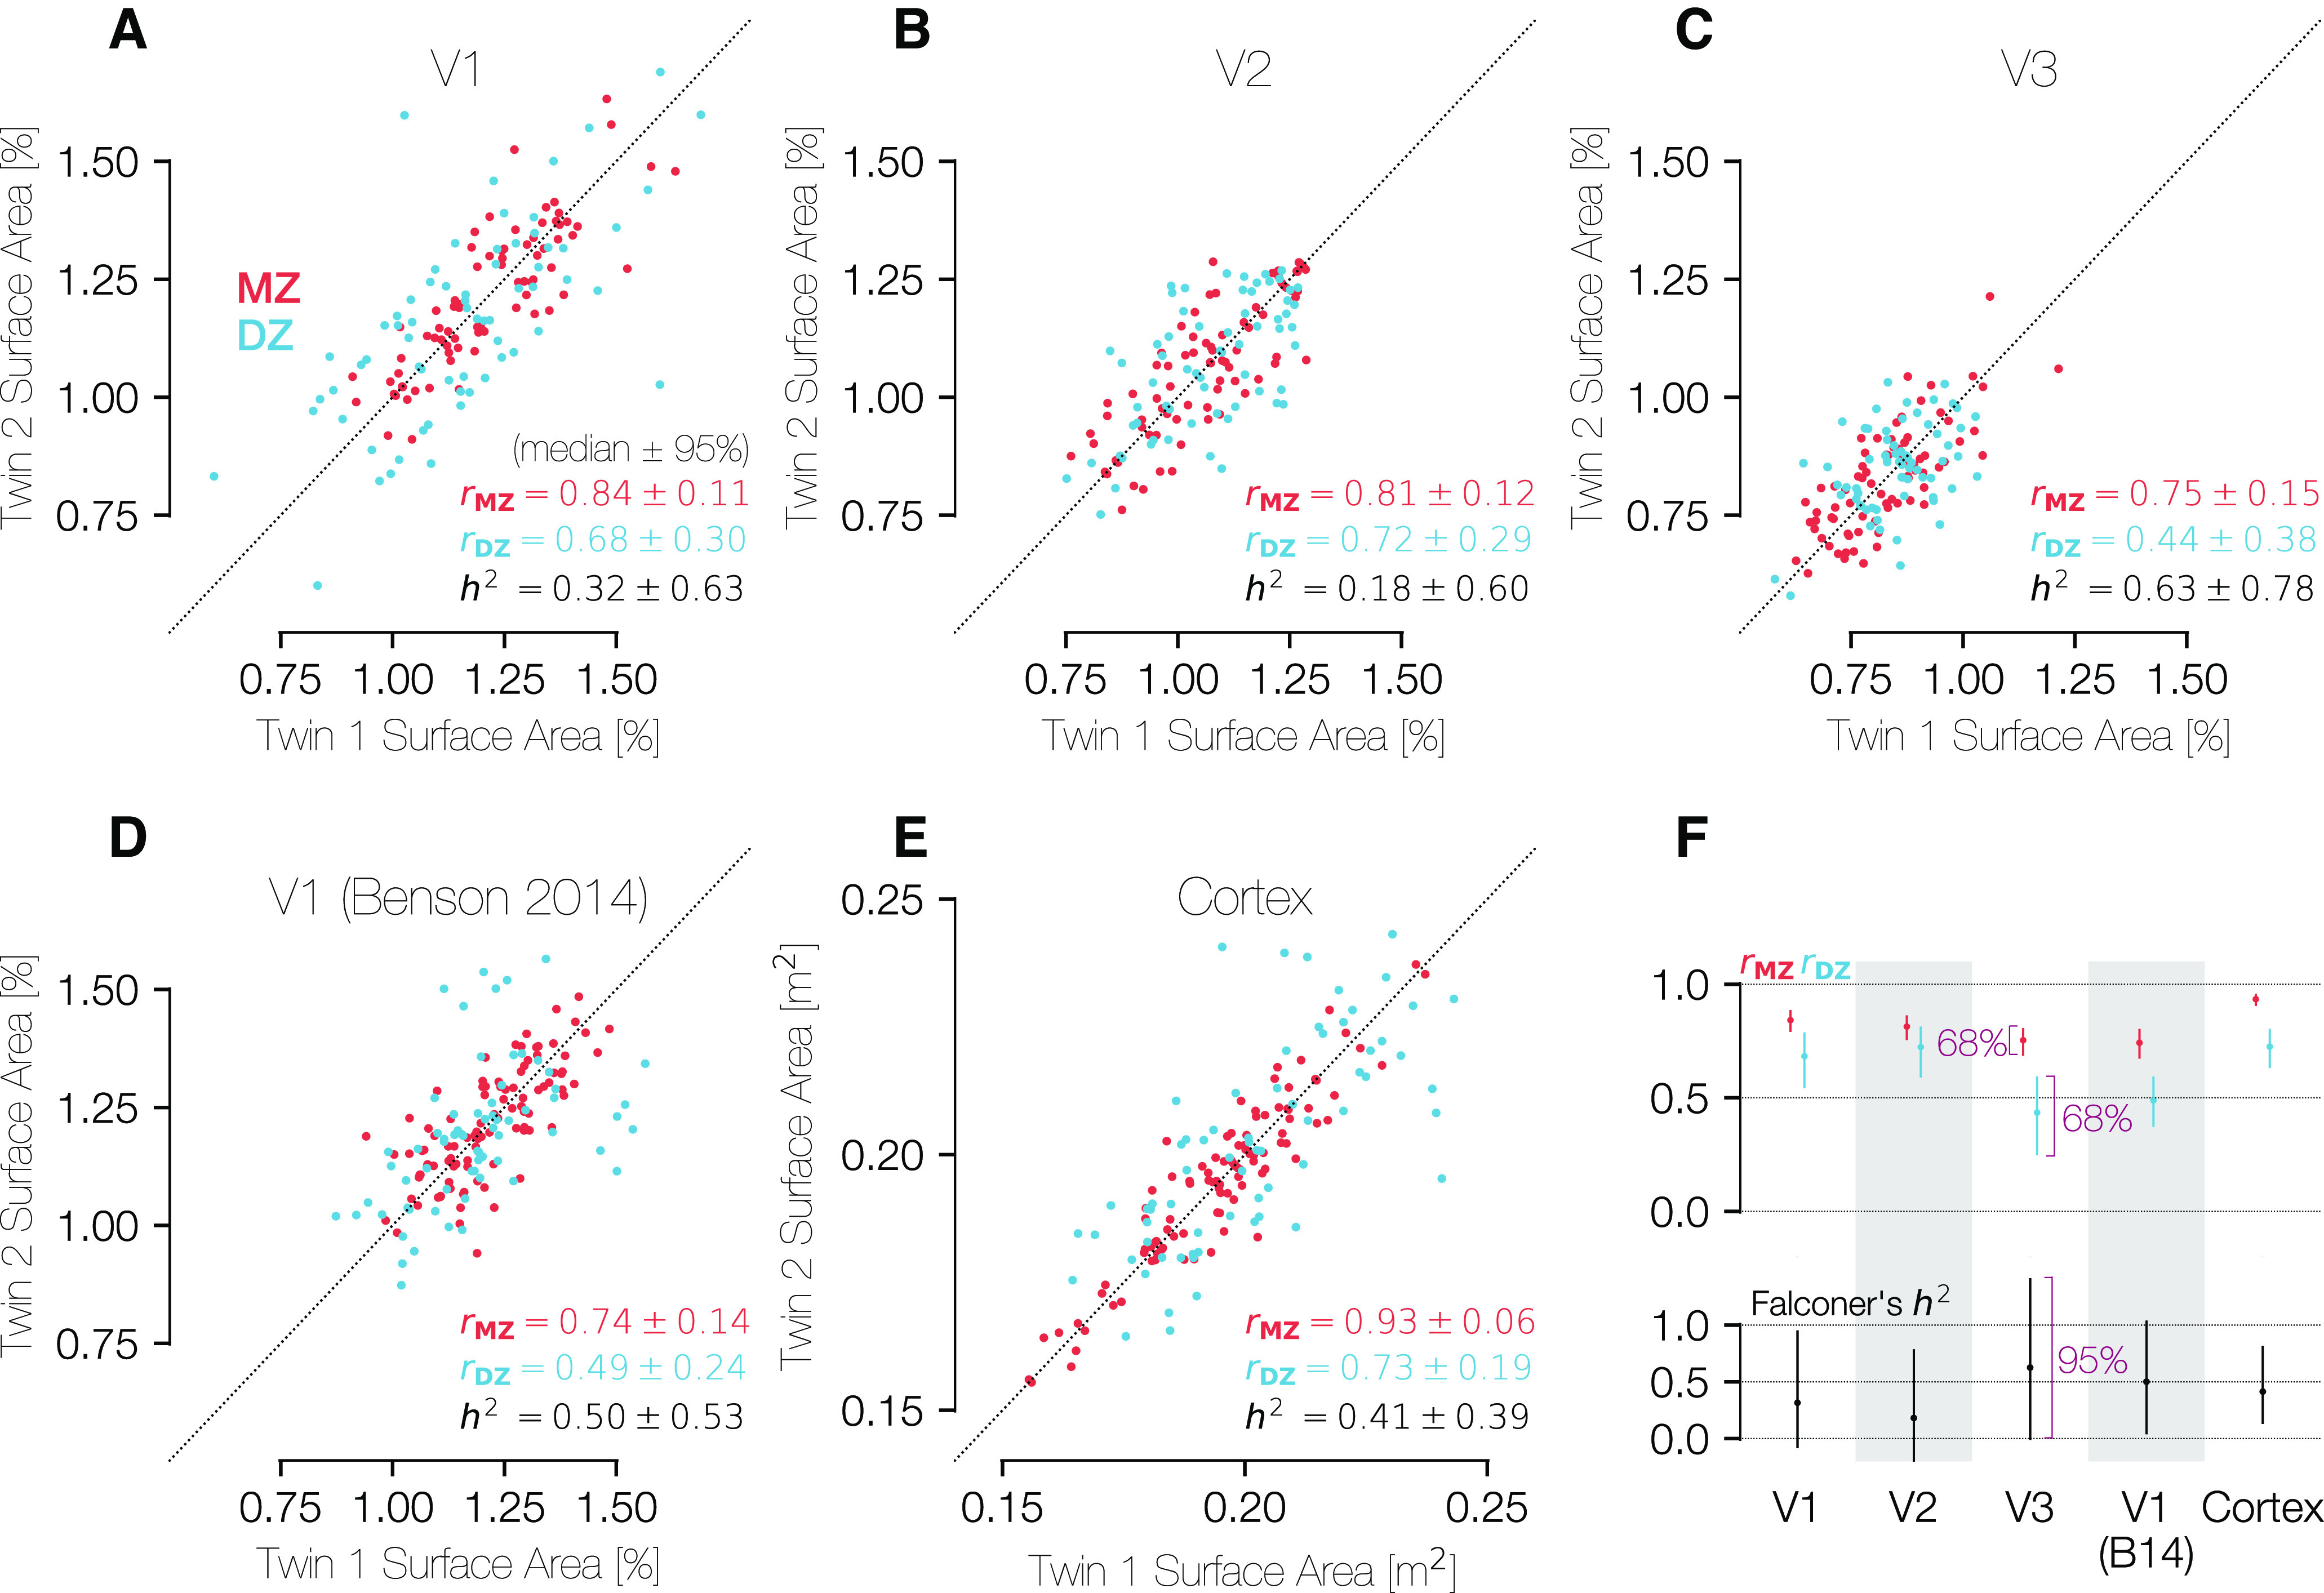
Figure 9.

Correlations in the sizes of brain areas across MZ and DZ twins. The three panels in the top row show comparisons of the (A) V1, (B) V2, and (C) V3 percent of cortical surface area measurements for both MZ and DZ twin pairs. Because the assignment of a subject into the category of “twin 1” or “twin 2” is entirely arbitrary, all points plotted twice, reflected along the line x = y. D, Plots the same metric for the atlas V1 boundaries of Benson et al. (2014), which are obtained through anatomical alignment and thus represent an anatomical definition of V1. A-D, The surface areas were calculated between 0.5° and 7° of eccentricity only. E, Similar comparison of the entire cortical surface area across twin pairs in terms of square meters. F, Summary of correlations and heritability calculations for each ROI and relationship type (MZ/DZ). The H2 values were calculated using Falconer's formula of heritability. CIs were calculated using 1000 bootstraps over twin pairs. For the top row, CIs are at the 68% level (1 SEM), and for the bottom row they are at the 95% level. A-E, CIs are expressed as “± x” where x is half of the difference between the 97.5th and the 2.5th percentiles.
