Figure 1.

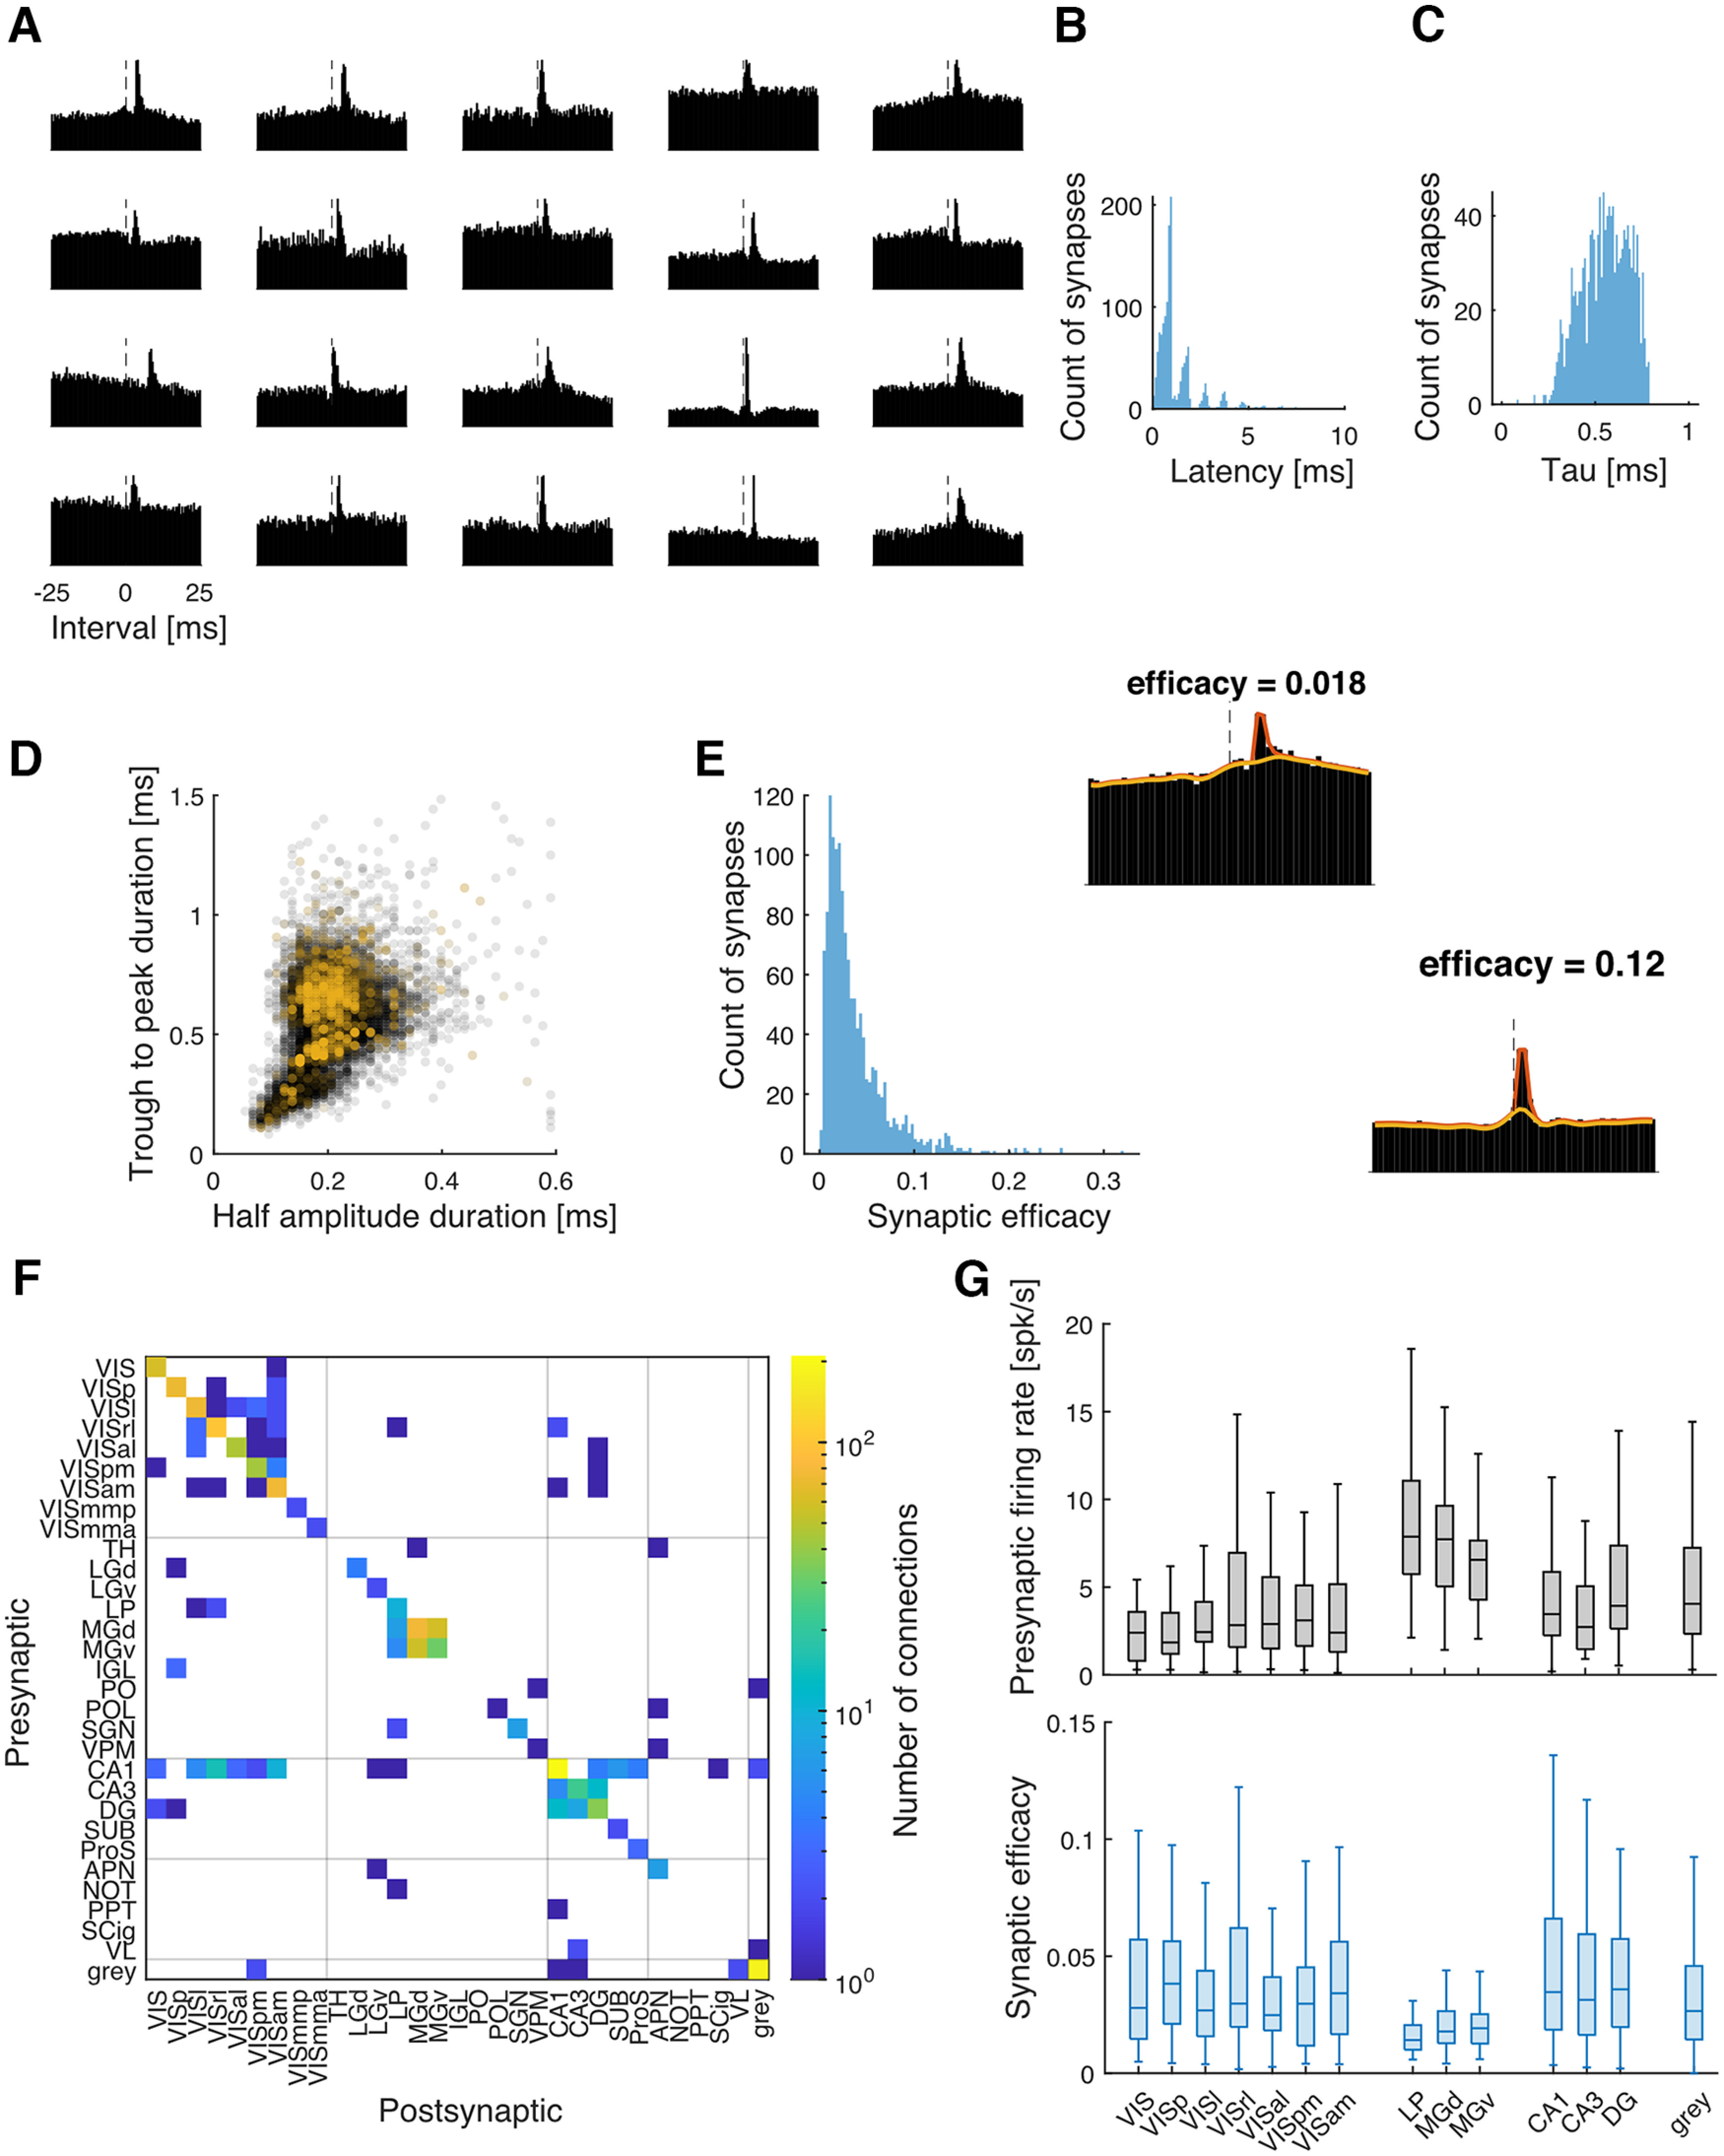
Detection of putative excitatory synaptic connections. A, Examples of CCGs of putative excitatory synaptic connections. The bin size is 0.5 ms here for better visualization. In the analysis, we use 1 ms. B, The histogram of synaptic latency of all the detected synapses. The distribution tends to peak at 1, 2, 3 … [ms] because the bin size of the CCG is 1 ms. C, The histogram of the synaptic time constant of all the detected synapses. D, Two measurements of the duration of waveforms. Each dot represents one neuron. Most putative presynaptic neurons (yellow dots) show broader spike waveforms compared with all the neurons in the dataset (gray dots). E, The histogram of the synaptic efficacy of all the detected synapses. Left, Example CCGs with low or high efficacy and the model fits of the extended GLM (red line, model fits with synaptic effect; yellow line, model fits without synaptic effect). F, Connectivity matrix across different areas (y-axis, presynaptic area; x-axis, postsynaptic area). Color represents the number of connections detected (log transformed). The gridlines separate the brain regions of visual cortex, thalamus, hippocampus, midbrain, and unclassified. Visual cortex (VIS), Primary Visual Area (VISp), Lateral visual area (VISl), Rostrolateral visual area (VISrl), Anteromedial visual area (VISal), Posteromedial visual area (VISpm), Anteromedial visual area (VISam), Mediomedial posterior visual area (VISmmp), Mediomedial anterior visual area (VISmma), thalamus (TH), dorsal/ventral lateral/medial geniculate (LGd/LGv/MGd/MGv), Lateral posterior nucleus (LP), Intergeniculate leaflet of the lateral geniculate complex (IGL), Posterior nucleus (PO), Posterior limiting nucleus (POL), suprageniculate nucleus (SGN), Ventral posteromedial nucleus (VPM), Dentate gyrus (DG), Subiculum (SUB), Prosubiculum (ProS), Anterior pretectal nucleus (APN), Nucleus of the optic tract (NOT), Posterior pretectla nucleus (PPT), Superior colliculus, intermediate grey matter (SCig), lateral ventricle (VL). G, Box plots for the mean firing rate (top) and efficacy (bottom) for brain areas. The areas are grouped by brain regions mentioned above. Only areas with ≥10 efferent synapses are shown here. The line inside each box is the median. The top and bottom edges of the box are the upper and lower quartiles, respectively. The whiskers show the nonoutlier maximum and minimum. The outliers are not shown here.
