
Figure 2.
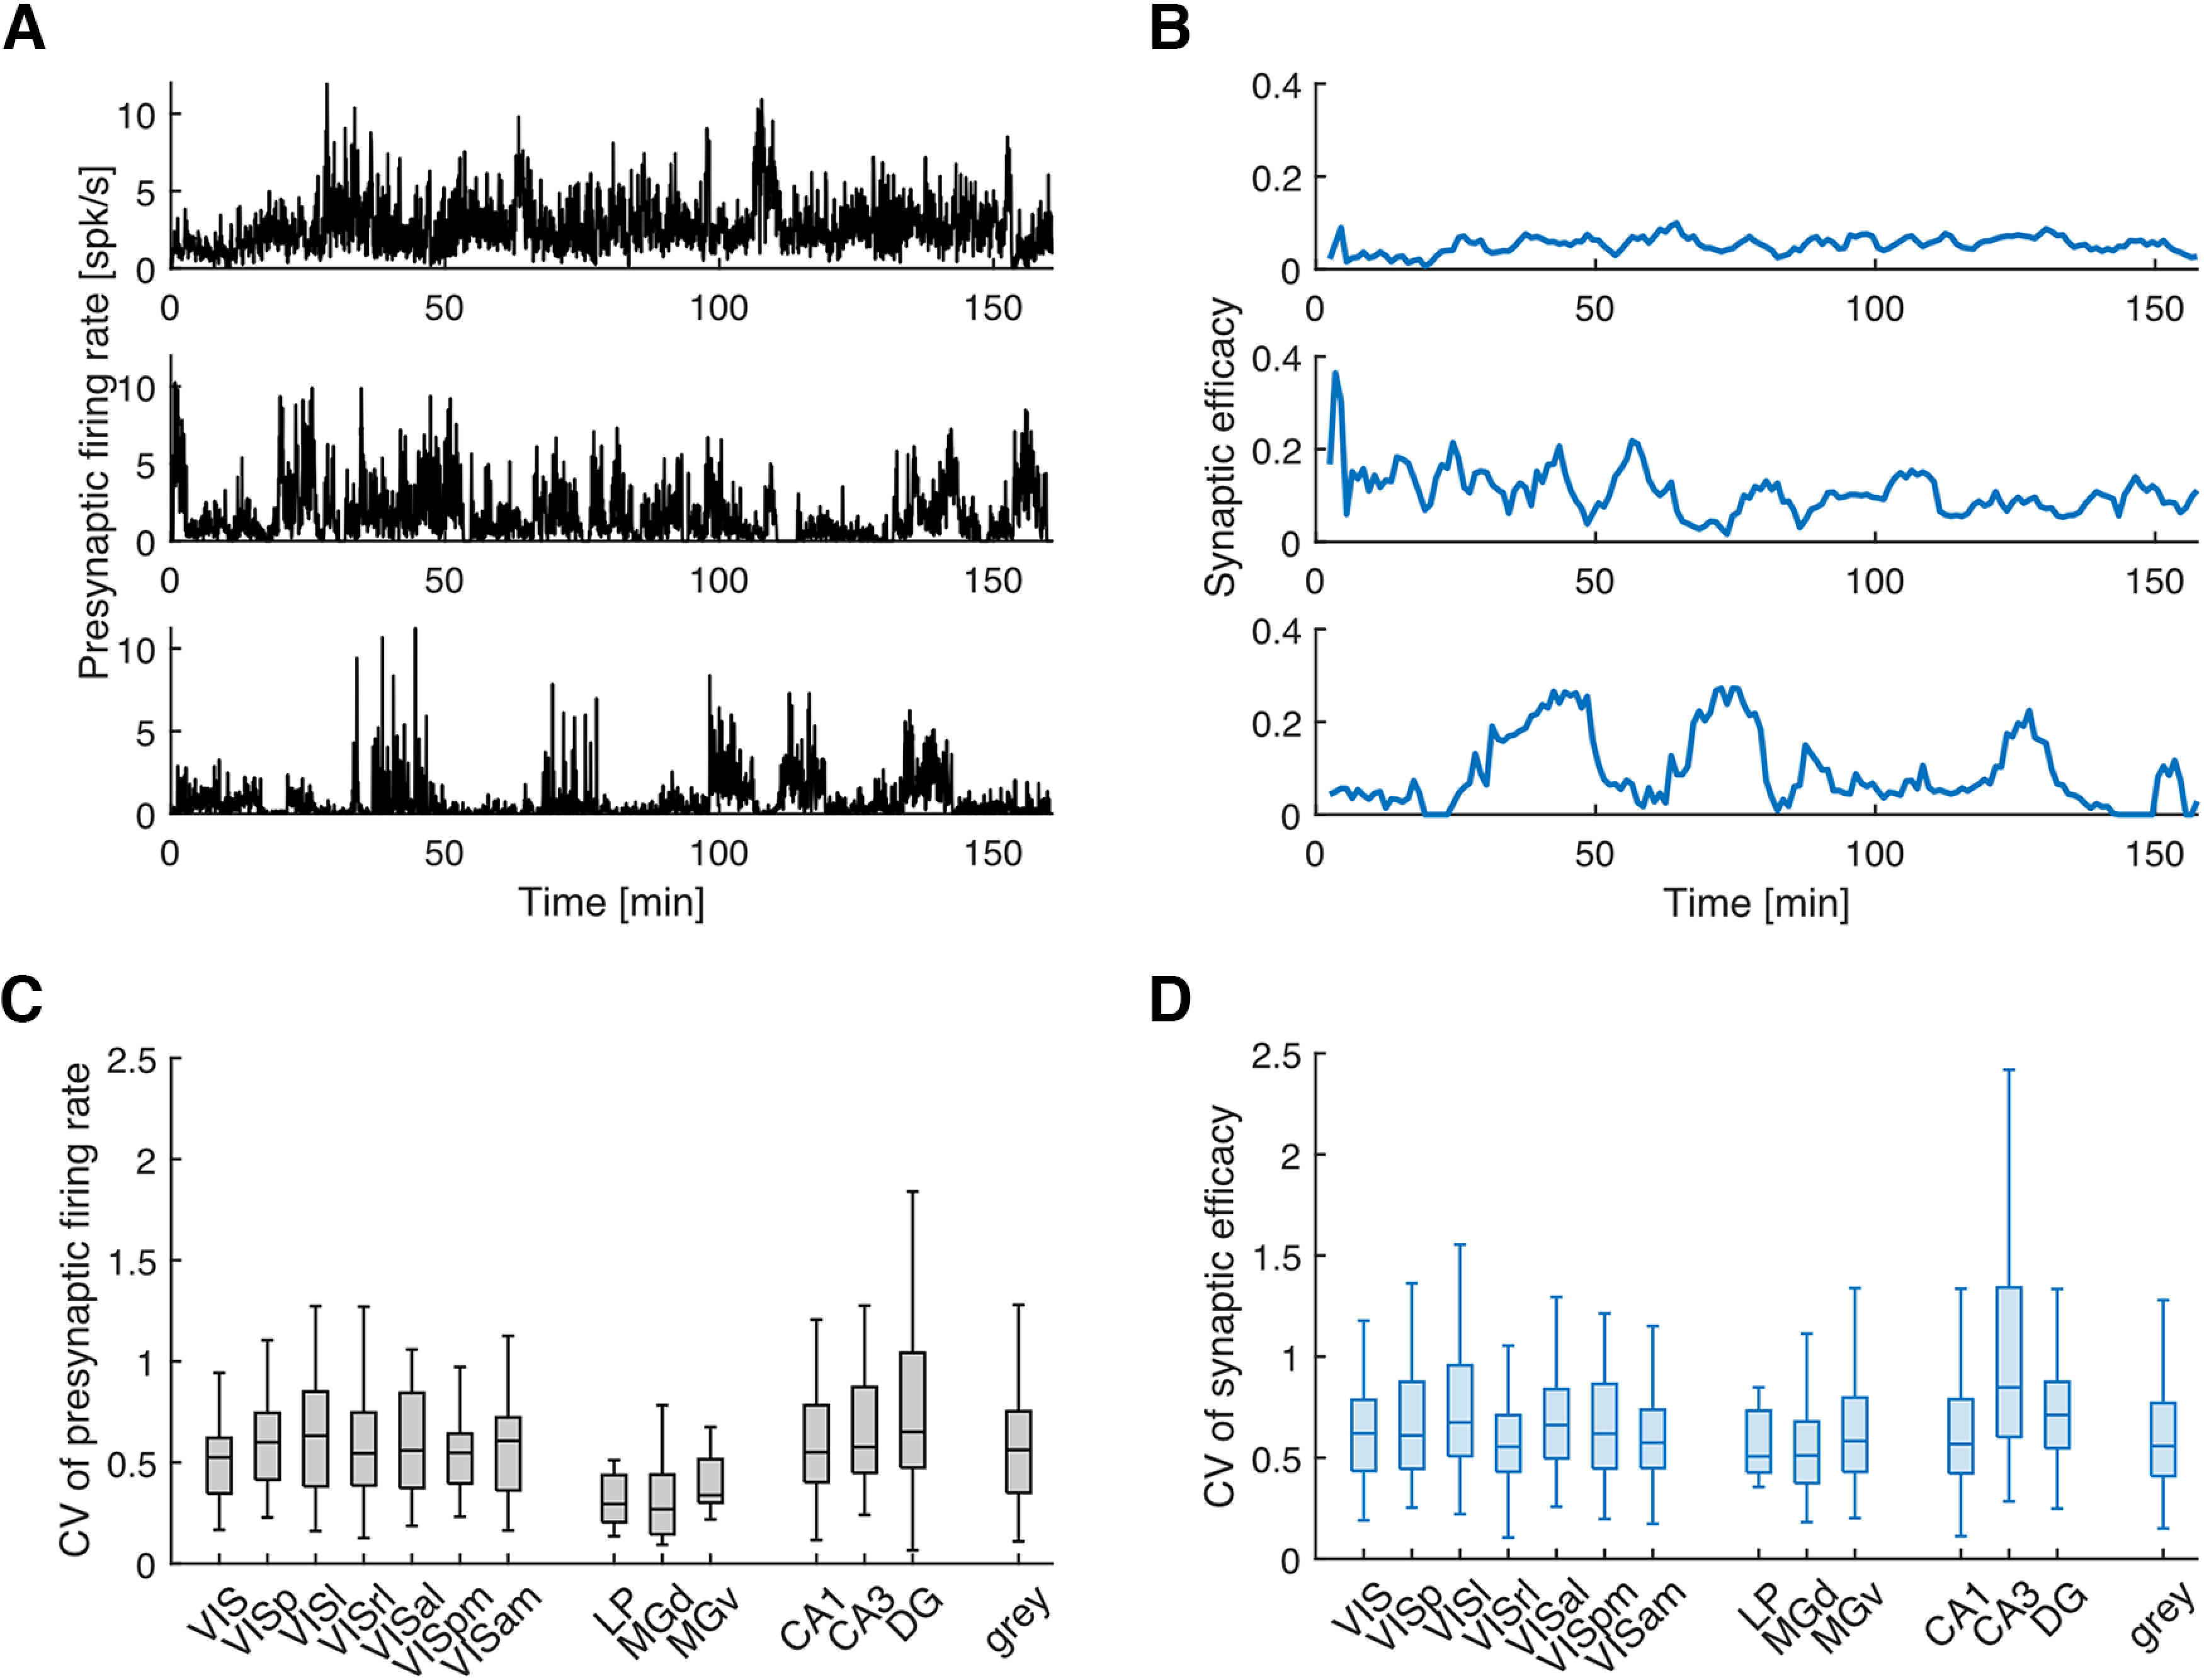
Fluctuations in presynaptic firing rate and synaptic efficacy. A, B, Three examples for fluctuations in presynaptic firing rate (A) and synaptic efficacy (B), respectively. Top, Low CV. Middle, Moderate CV. Bottom, High CV. The firing rates in A are estimated using optimal time bins that are generated based on Shimazaki and Shinomoto (2010) for better visualization on finer timescales. The efficacy in B is estimated based on the 5 min window described in Materials and Methods. C, D, The box plots for CVs of presynaptic firing rate (C) and synaptic efficacy (D) for each area. Only areas with ≥10 efferent synapses are shown here. The notations are the same as in Figure 1.