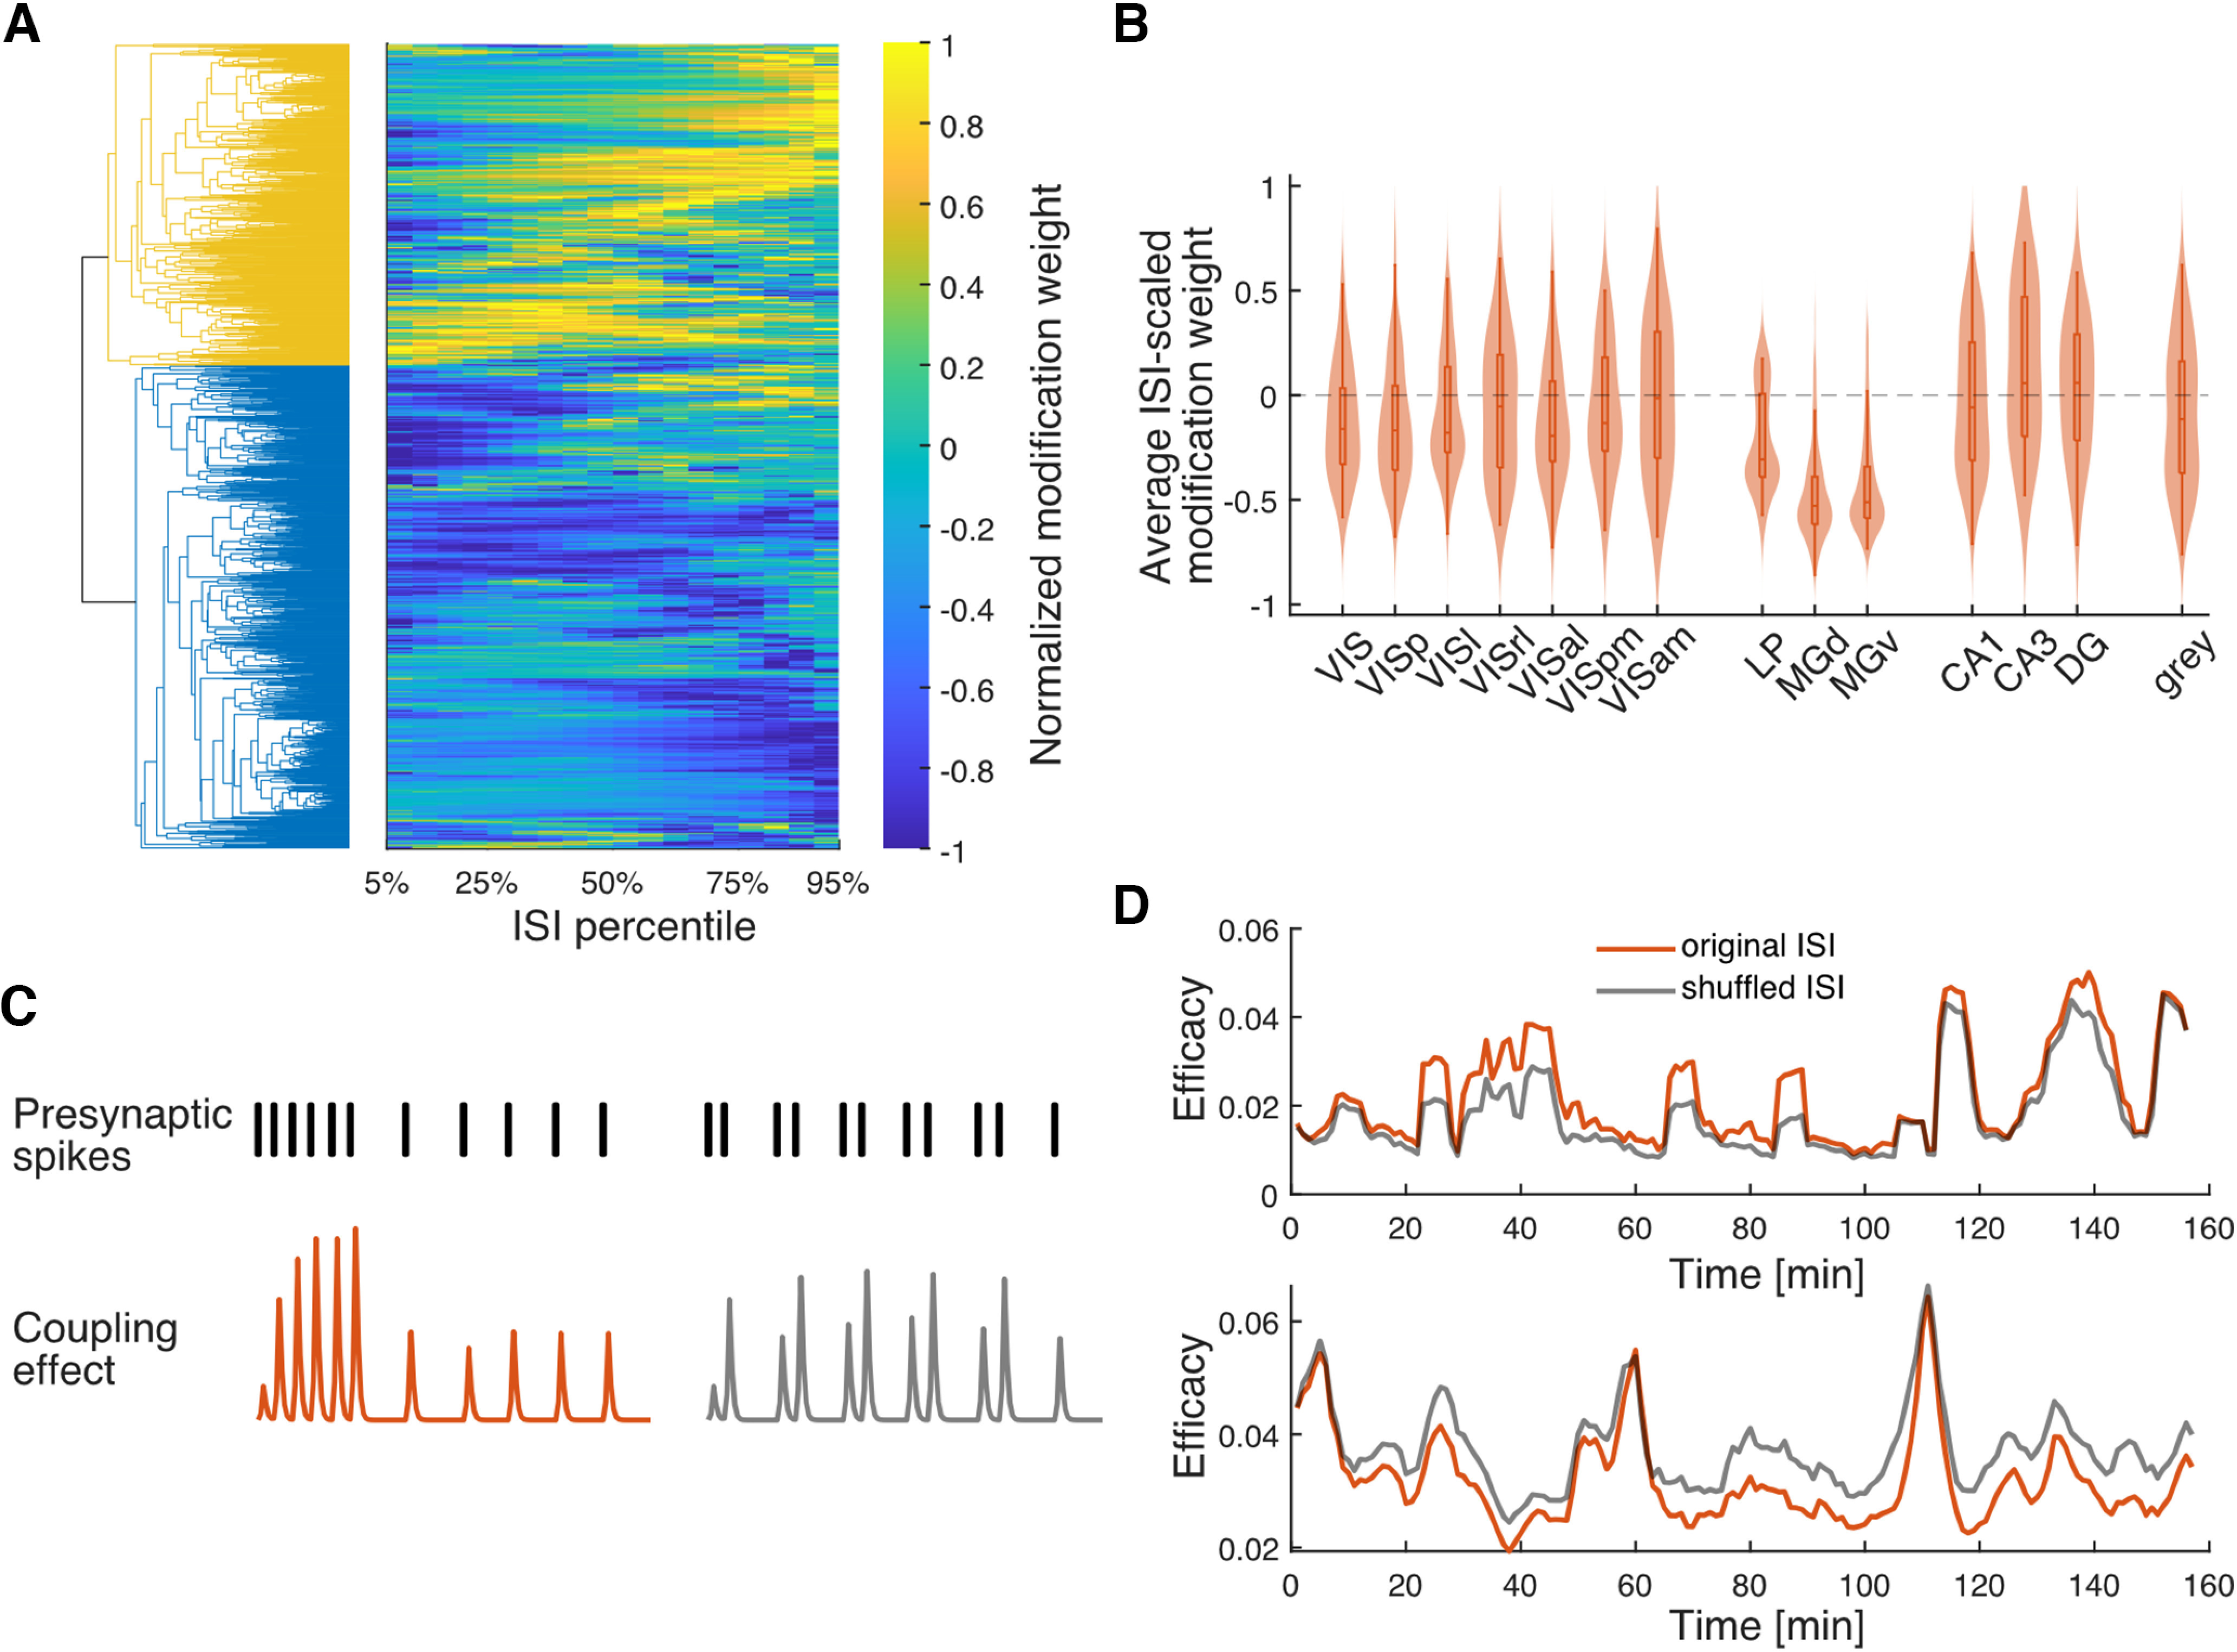
Figure 6.

Hierarchical clustering for modification functions. A, Right, The modification functions of all putative synapses sorted based on the clustering results; each row represents one modification function. Left, The dendrogram of the hierarchical clustering. Colors represent the top two clusters. B, The violin plot of the mean of the modification function for each brain area. Only areas with ≥10 efferent synapses are shown. C, Schematic illustrating how the same modification rule and presynaptic ISI distribution can result in different efficacy fluctuations. Top, Two example presynaptic spike trains with the same number of spikes and the same ISI distribution but different ISI sequences. Bottom, The resulting coupling effects for both spike trains simulated using one facilitation modification function. Note that the presynaptic spike train on the left results in a synaptic strength that is stronger on average than the train on the right. D, The GBLM estimated efficacy from the original data (the orange lines in Fig. 6D are the same as the orange lines in Fig. 5C,D (bottom), and from the postsynaptic activity reconstructed using shuffled presynaptic spikes (gray).
