
Figure 2.
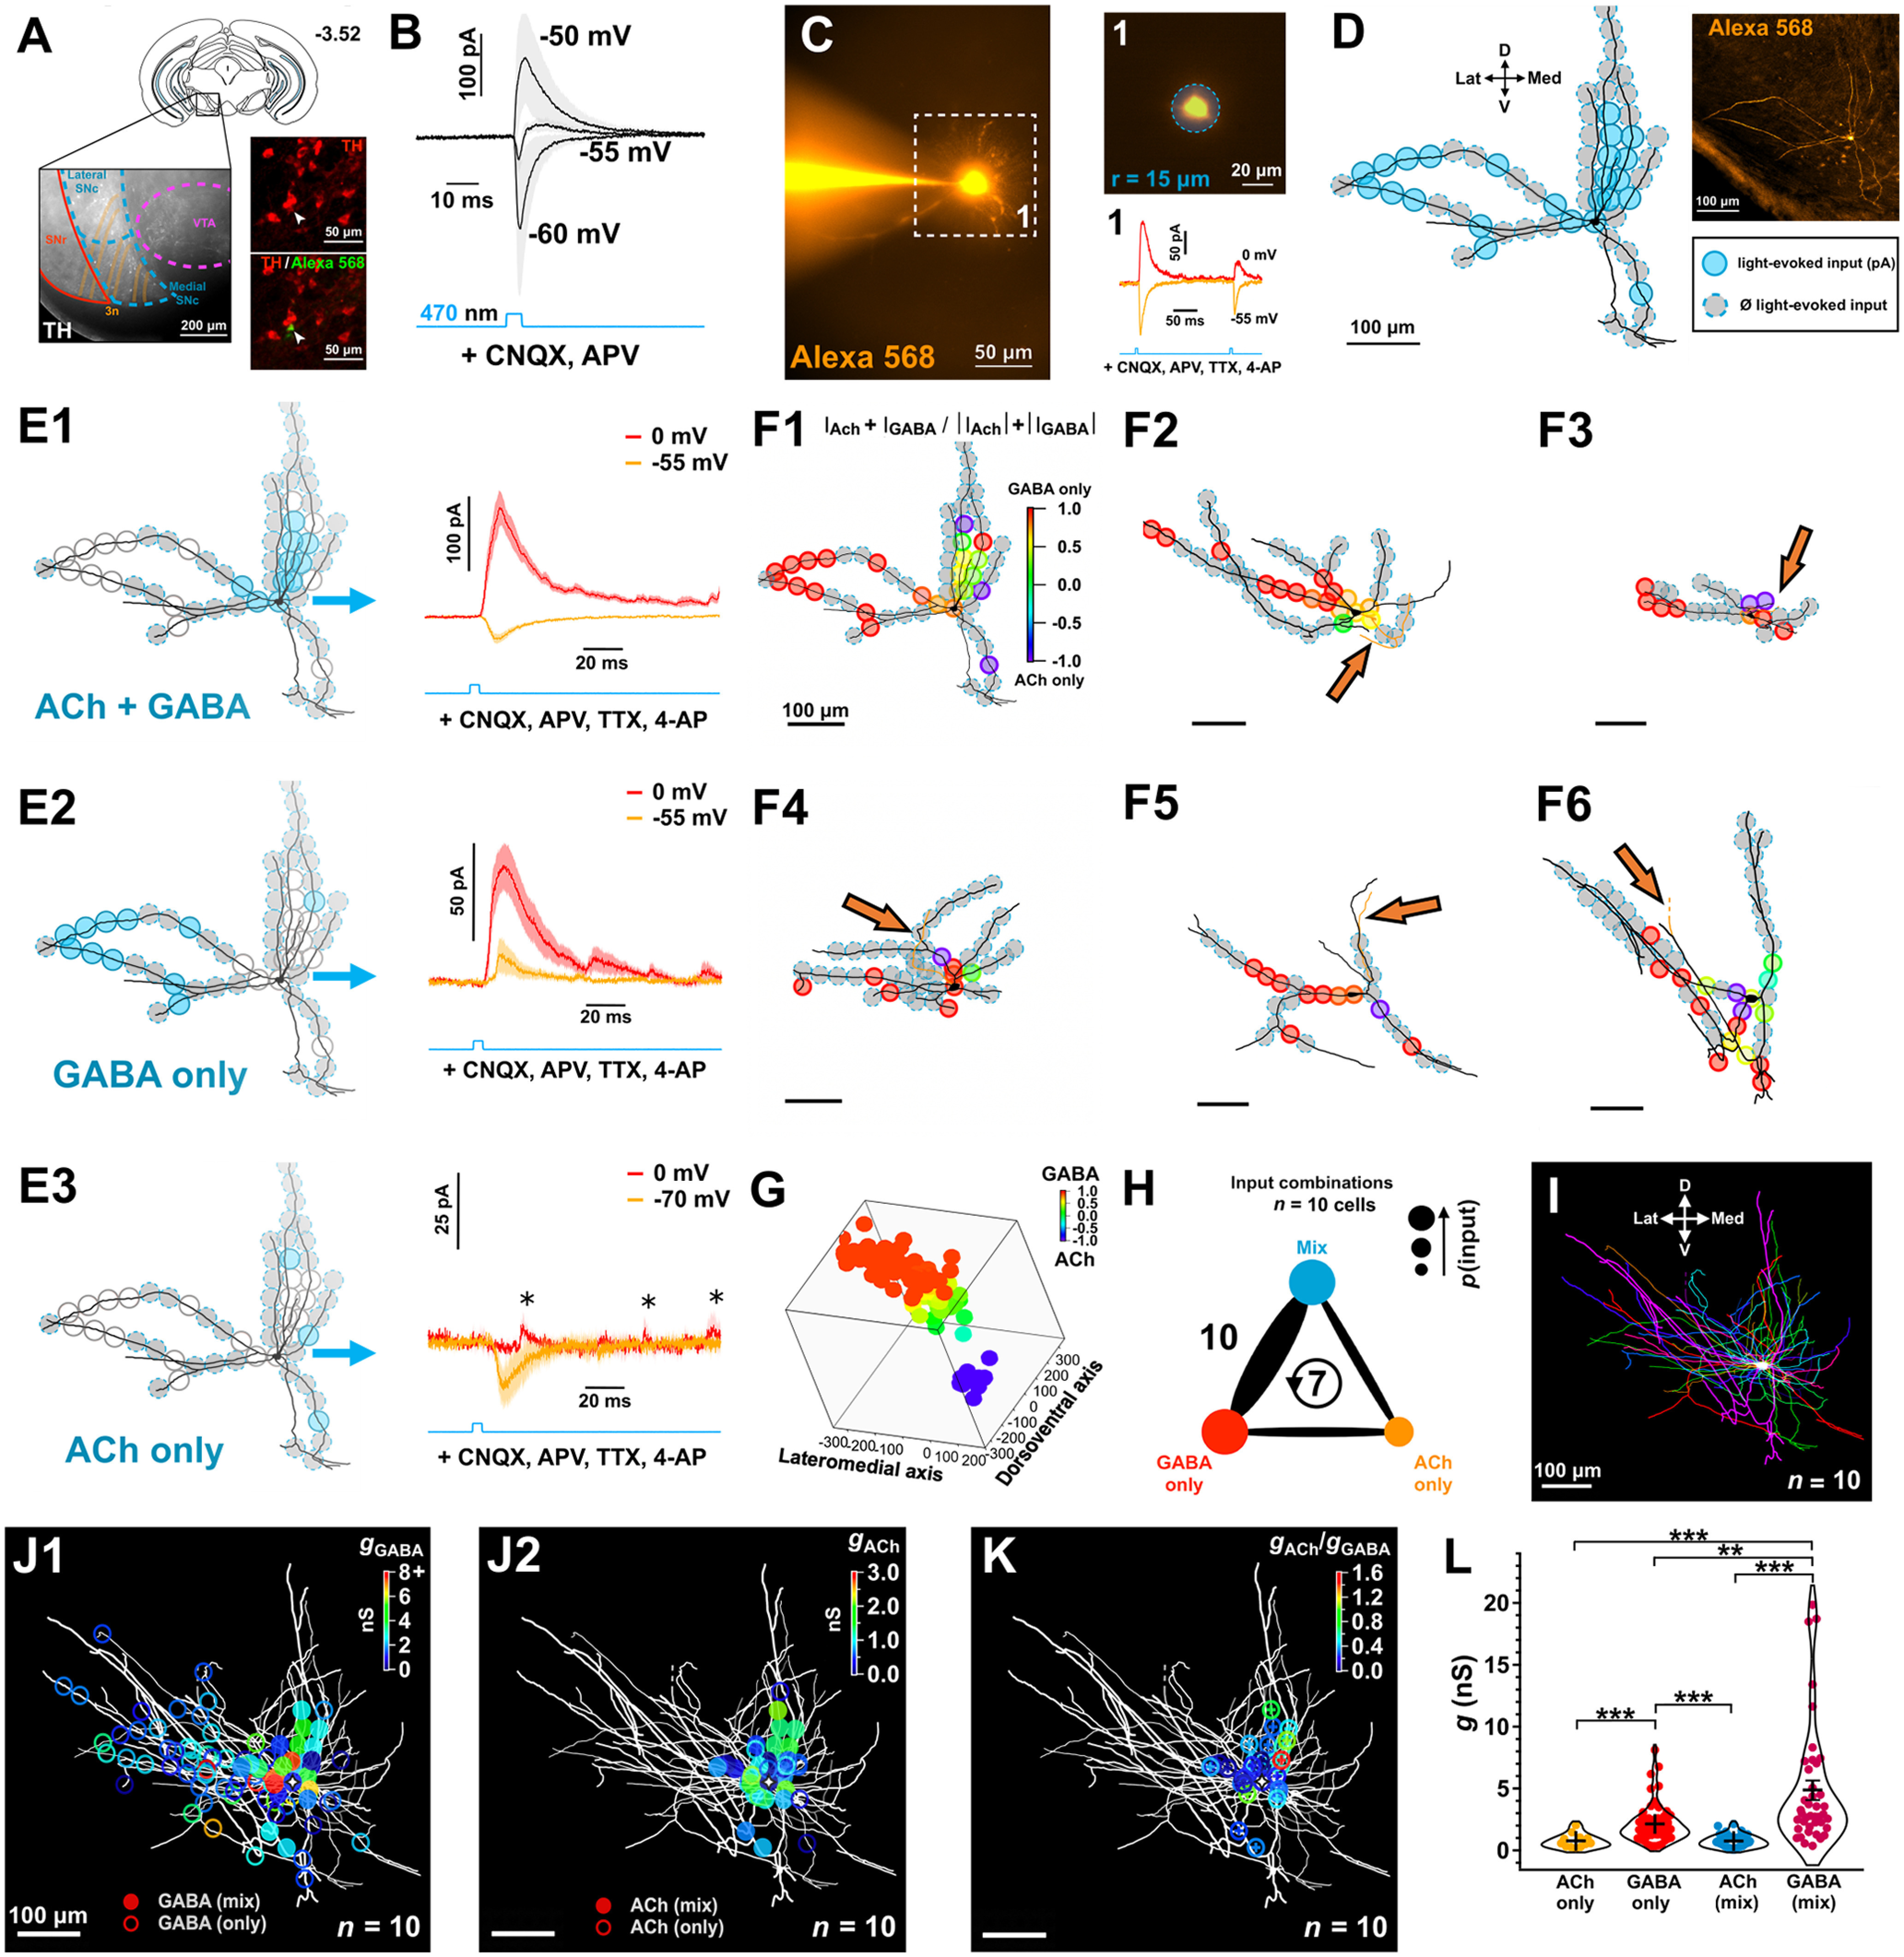
Subcellular mapping of functional ACh and GABA cholinergic synaptic inputs. A, Diagram of a coronal slice (bregma −3.52 mm) showing the substantia nigra (medial portion) region where we studied ChAT-DA connections using optogenetic stimulation of ChAT+ axons and whole-cell recordings of DA neurons. Branches of the oculomotor nerve (3n) were used as a landmark to target the medial SN. Patched neurons were dye-filled to confirm DA phenotype post hoc via TH immunolabeling. B, Whole-cell voltage-clamp recordings of light-evoked ChAT-DA transmission at different holding potentials in the presence of CNQX and D-AP5 (n = 3 cells from 3 mice). Note the biphasic component indicating putative ACh/GABA cotransmission. C, Example of monosynaptic light-evoked ACh (hold = −55 mV) and GABA (hold = 0 mV) PSCs from a 30-μm-diameter optical stimulation on a medial SN DA neuron dye-filled with Alexa-568 (80 μm) following bath application of CNQX, D-AP5, TTX, and 4-AP. D, Input map overlaid on the recorded neuron following post hoc neuronal tracing. Inputs where PSCs were evoked are color-coded. Recorded neurons in this and subsequent experiments were orthogonally aligned to the midline position. E1–E3, Focal whole-cell recordings of monosynaptic light-evoked PSCs across inputs show differential subcellular distribution of ACh and GABA release from ChAT:ChR2 axons. PSCs were organized by input type (mean ± SEM is plotted). F1–F6, Examples of input maps overlaid on reconstructed neurons. The relative contributions of ACh and GABA to the total recorded current across the two voltage potentials (−55 and 0 mV) are color-coded for each local optical stimulation. Ankyrin-G staining on DA cells (n = 5 cells from 5 mice) before neuronal tracing reveals variation in location of the axon initial segment relative to the soma (orange arrows). G, 3D superimposition of input maps as a function of the relative contributions of ACh and GABA to each local input site shows a differential distribution of input types across orthogonal axes. H, Summary of input type pairs observed on mapped DA neurons. Thickness of the connecting line indicates the frequency with which a pair was observed. Values are number of cells per pair. Circular arrow represents cells where all three input types were observed. I, Superimposition of mapped DA neurons aligned to the midline and cell-body centered. Note the asymmetry of dendritic fields. J1-J2, ACh and GABA input maps overlaid on superimposed neurons. ACh and GABA conductances were derived for individual local inputs and organized by input type. K, Absolute ratios of ACh and GABA conductances for recorded ACh/GABA inputs. F–K, n = 10 cells from 10 mice. L, ACh and GABA conductances per local input as a function of the input type. *p < 0.05; **p < 0.01; ***p < 0.001; Aligned Rank Transformed (ART) ANOVA with post hoc pairwise contrast tests for main effects with Tukey correction. Data are mean ± SEM.