
Figure 3.
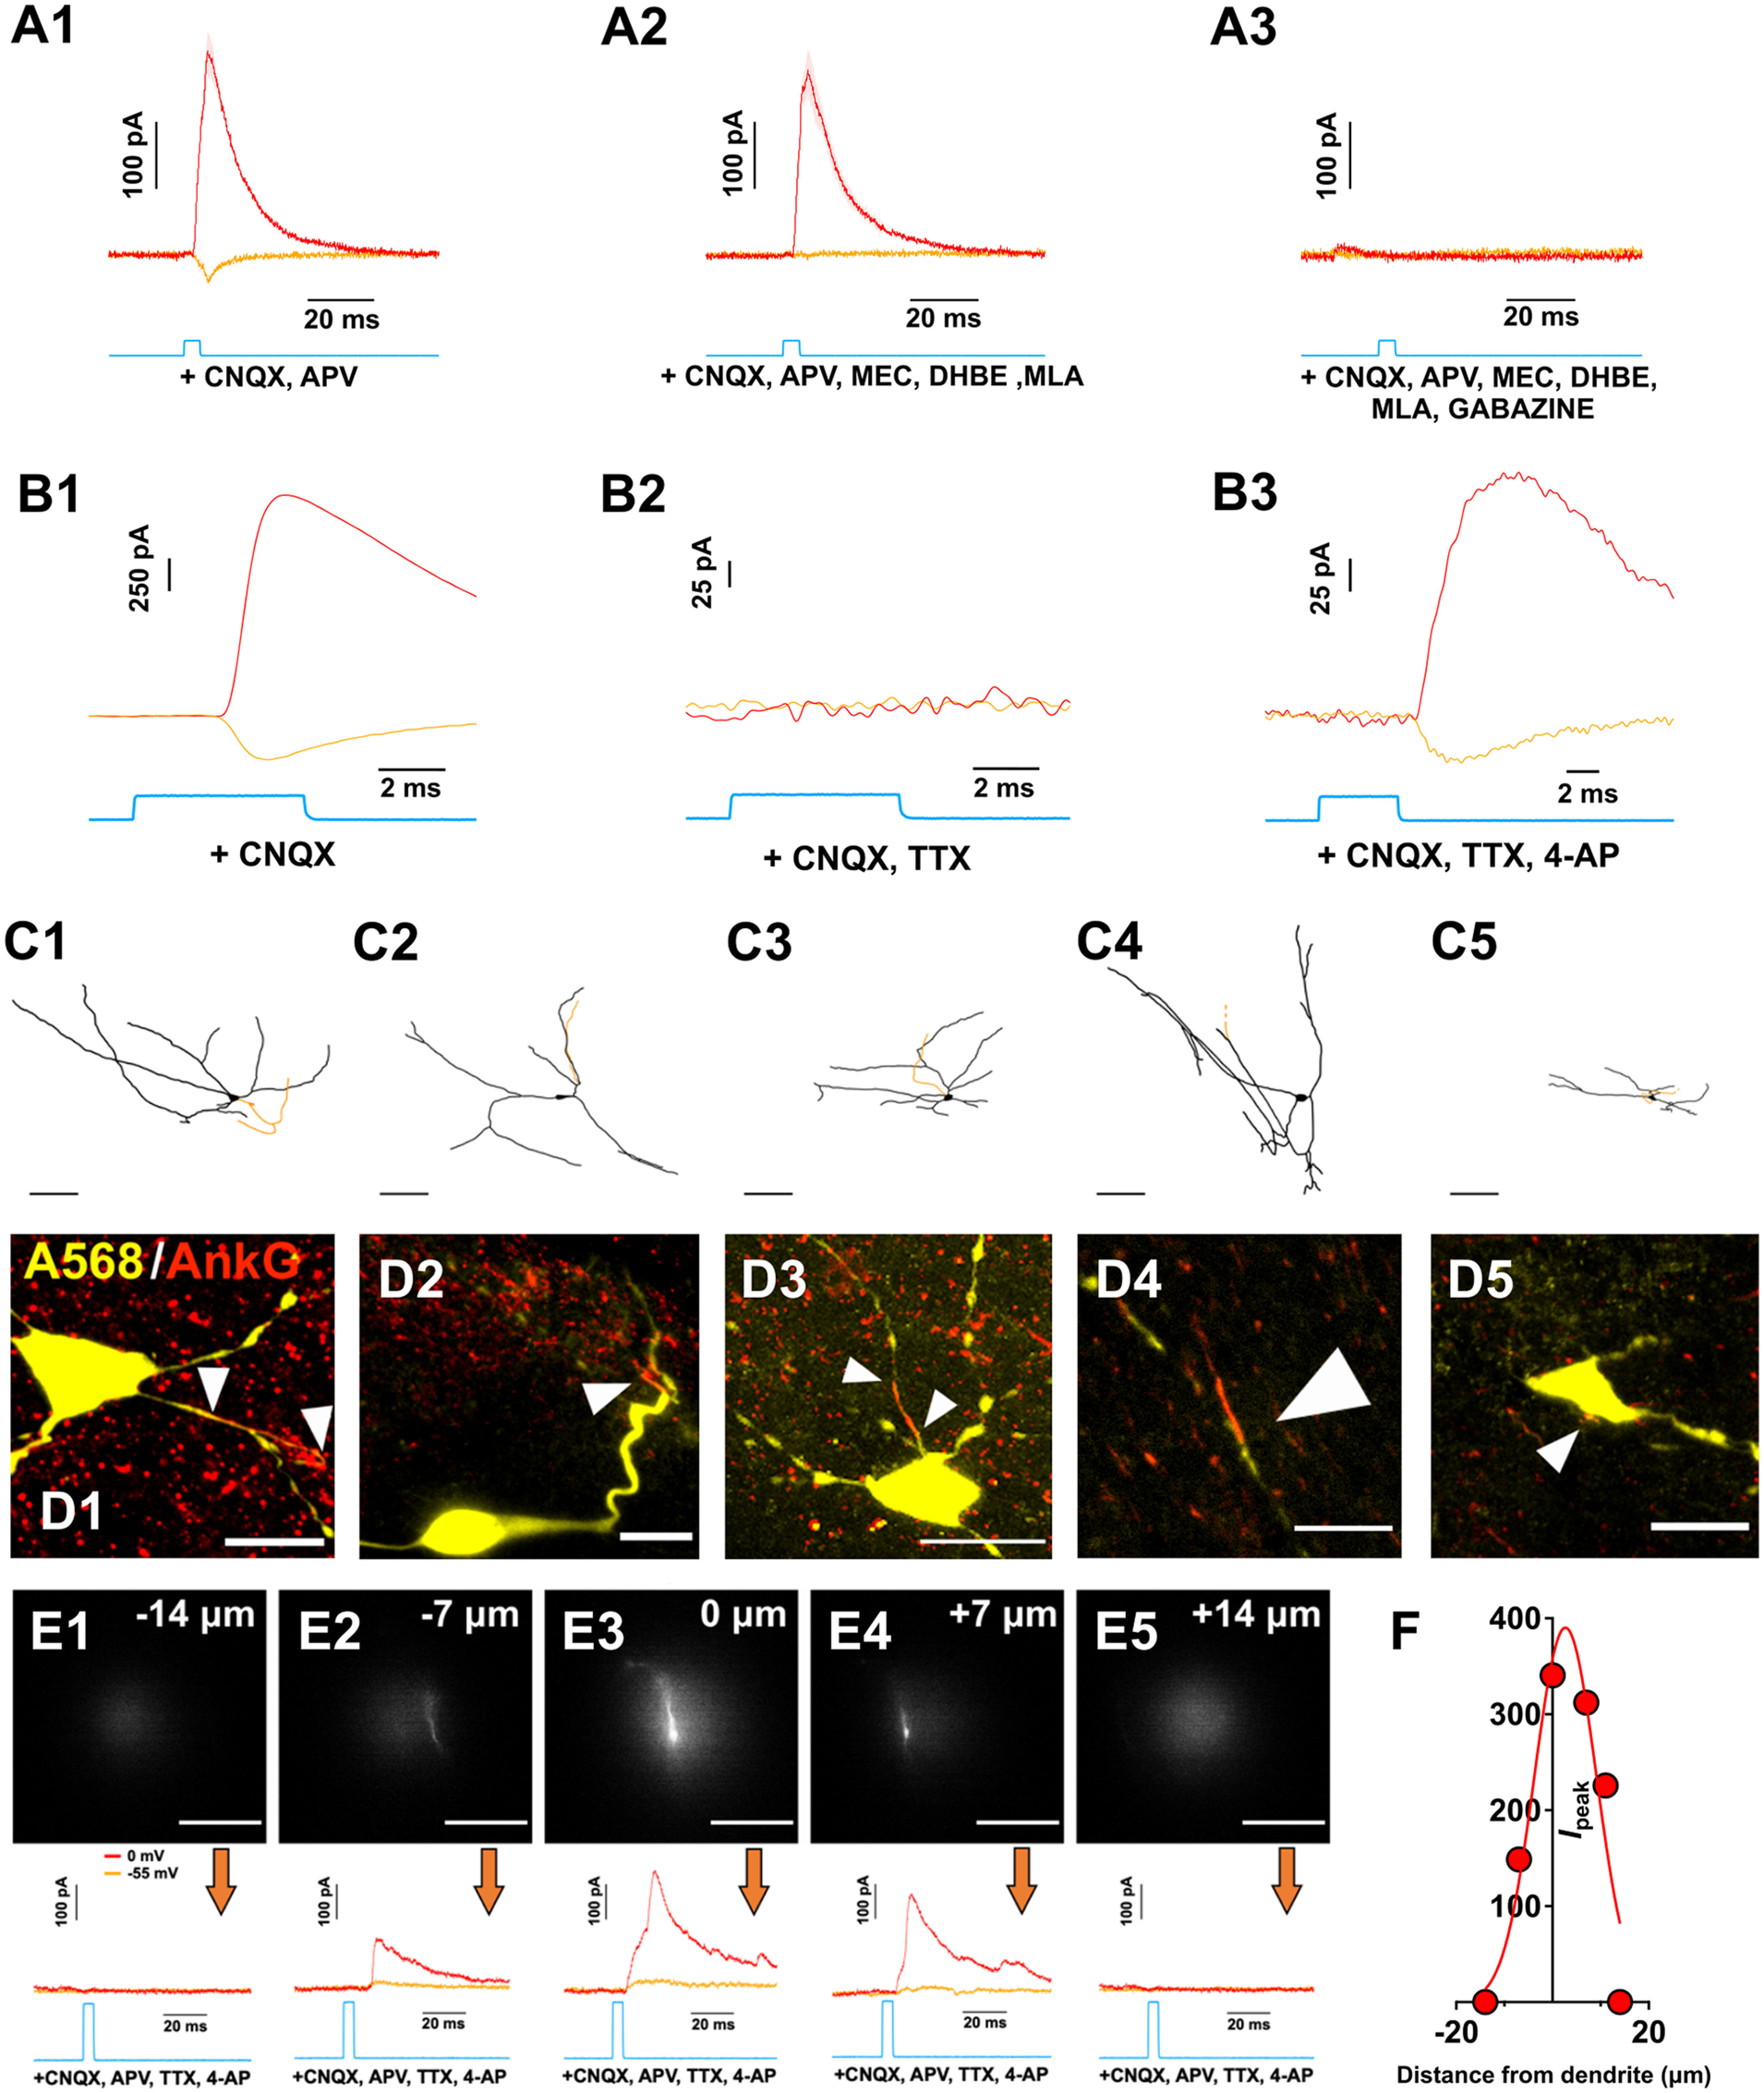
Control experiments showing pharmacological inhibition of ACh and GABA responses, pharmacological isolation of monosynaptic synaptic inputs with TTX and 4-AP, ankyrin staining of dye-filled neurons, and quantification of the effective resolution of the functional synaptic mapping technique. A1–A3, Example of light-evoked pharmacologically isolated ACh/GABA PSCs from a medial SN DA neuron. The neuron was voltage-clamped at −55 mV (orange) to isolate EPSCs and at 0 mV (red) to isolate IPSCs. All PSCs were recorded in the presence of glutamate receptor antagonists CNQX and D-APV (baseline). ACh PSCs were subsequently suppressed using a cocktail of nicotinic receptor antagonists (MLA, DHβE, MEC) and GABA PSCs were suppressed with gabazine (from left to right). n = 1 cell from 1 mouse. B1–B3, Example light-evoked PSCs from a medial SN DA neuron voltage-clamped at −90 and 0 mV in the presence of CNQX (baseline) and following subsequent bath application of (left to right) TTX and 4-AP. This indicates that the evoked nicotinic EPSCs and evoked GABA IPSCs are AP dependent and monosynaptic. n = 1 cell from 1 mouse. C1–C5, Reconstructed medial SN neurons immunostained for ankyrin-G to label the axon initial segment. Scale bar, 15 μm. n = 5 cells from 5 mice. D1–D4, Confocal images of recorded medial SN neurons filled will Alexa-568 dye and immunostained for ankyrin-G (red) to indicate the localization of the axon initial segments (white arrowheads). E1–E5, Measurements of the postsynaptic GABA currents evoked by an illumination spot positioned lateral to the dendrite of the recorded neuron. Optical illumination spot (∼30 μm diameter) was moved perpendicular to the dendrite in the X-Y plane in 7 μm increments (dendrite visualized with 80 μm Alexa-568 hydrazide). Scale bar, all images: 20 μm. Associated voltage-clamp recordings (orange = −55 mV; red = 0 mV) in the presence of CNQX, D-APV, TTX, and 4-AP. F, Responses showed in E were fitted with a Gaussian function. Width at half maximum was found to be 15 μm. E, F, n = 1 cell from 1 mouse.