Figure 8.

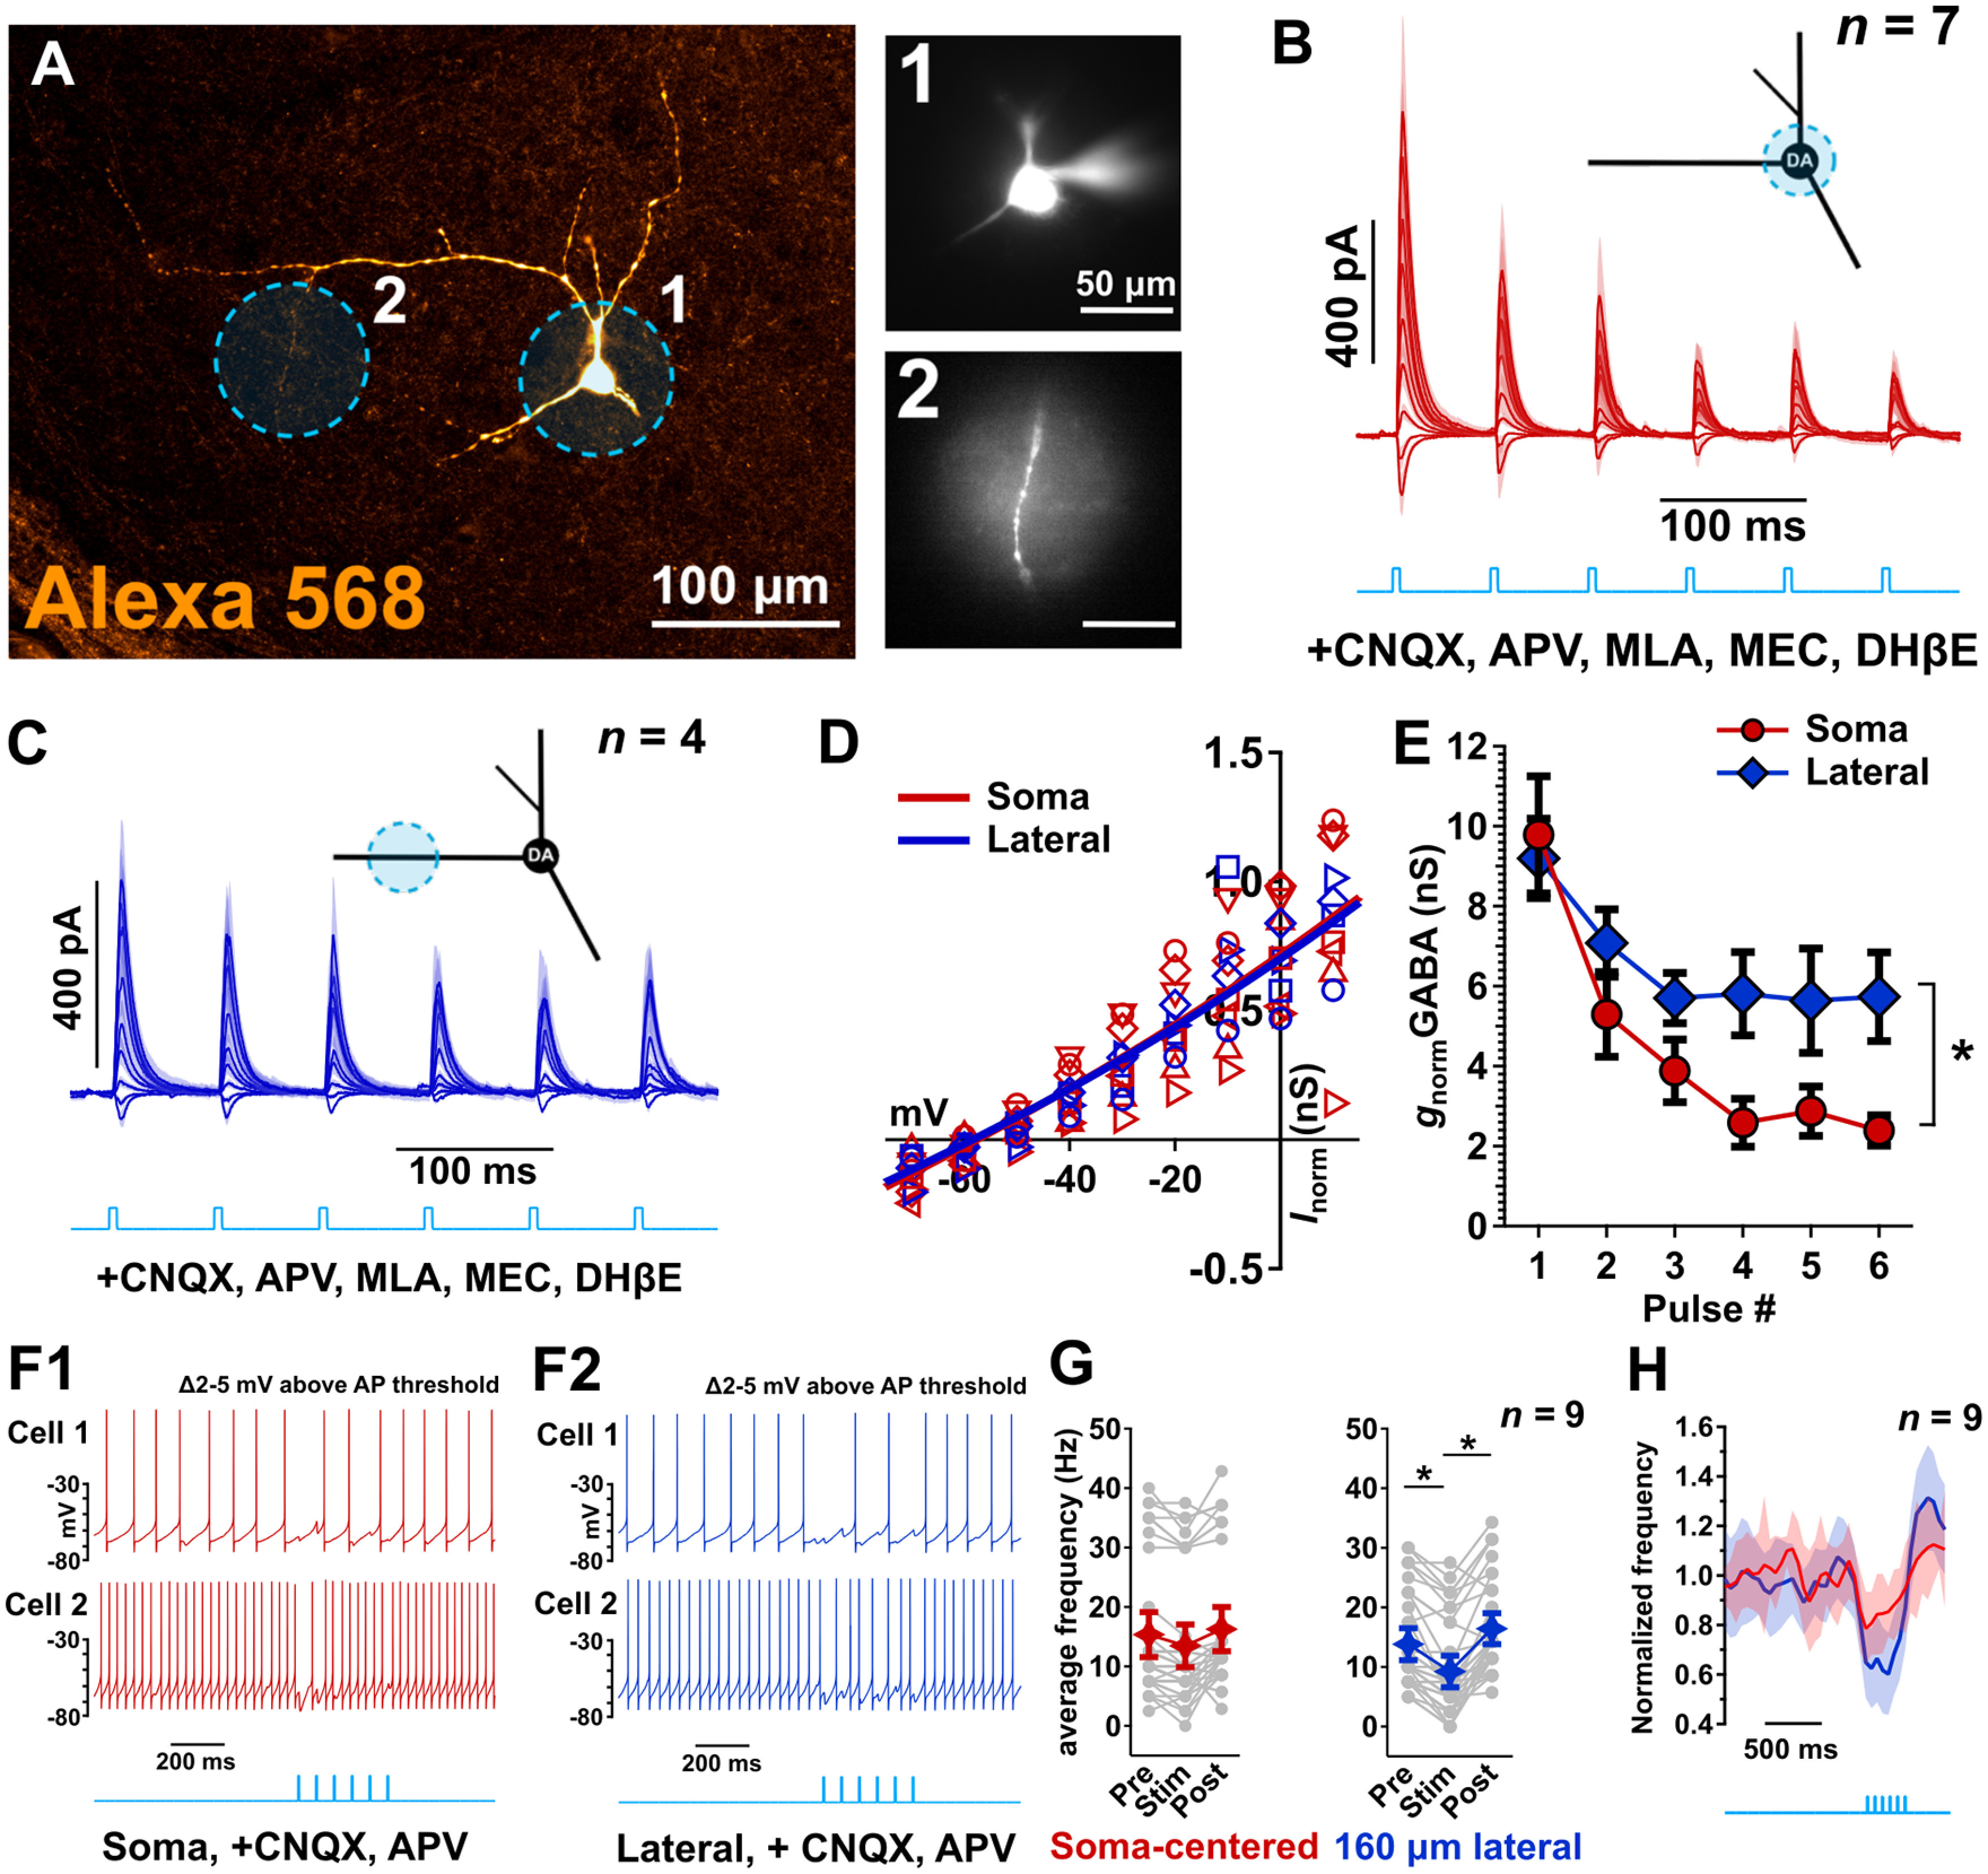
Soma-centered versus lateral dendrite located GABA synaptic transmission shows different short-term plasticity and effects on neuronal excitability. A, Experimental design to investigate the isolated GABAR conductance between the mix nAChR/GABAR conductance proximally and the lateral primary GABAR conductance. Stimulation fields were restricted to 80 μm. An example DA neuron used in the experiment is shown. B, Whole-cell voltage-clamp recordings of local (80-μm-diameter; blue light) soma-centered GABAR-mediated currents in conditions similar to that of Figure 7. Responses are measured in the presence of CNQX, D-APV, MEC, DHβE, and MLA. Data are mean ± SEM. C, Similar to B, GABAR currents were measured on a lateral dendrite 160 μm away from the cell body. B, C, n = 7 cells from 7 mice, n = 7 cells for the proximal focal stimulation, n = 4 cells for the lateral focal stimulation (repeated measurements). D, The I–V relationships computed from the currents in B and C and modeled by their respective weighted linear sum of the receptor basis functions as estimated in Figure 7 (thick blue and red lines). The high degree of overlap between fitted I–V shows that the voltage-clamp data were of adequate quality for the deconvolution procedure. E, Normalized estimated medial and lateral GABAR conductances as a function of the pulse number. The lateral GABAR contribution shows less decrease with repeated stimulation compared with the medial GABAR response. Nonparametric F1-LD-F1 factorial test. F1, F2, High current-driven firing (∼15 Hz) in medial DA cells was differentially diminished following local (80 μm) soma-centered versus lateral optical stimulation (15 Hz, 6 pulses). G, Average frequencies prior, during, and after optical stimulation reveal a stronger distal lateral inhibition of AP generation compared with soma-centered optical stimulation. Dunn's test with Bonferroni correction. H, Firing frequencies of medial SN DA cells normalized to baseline confirm the transient inhibitory potential of soma-centered optical stimulation (red line) compared with the more sustained lateral inhibition (blue line). F–H, n = 9 cells from 9 mice (F, examples; G,H, population data). *p < 0.05. **p < 0.01. ***p < 0.001. Data are mean ± SEM.
