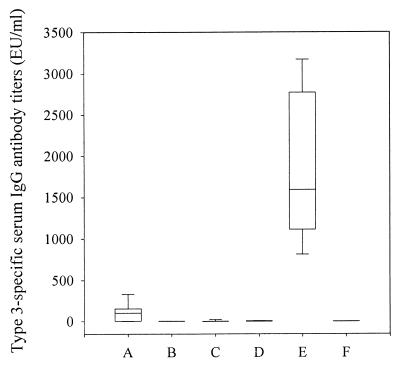
FIG. 2.
Type 3-specific serum IgG antibody titers after immunization with PNC-3 and PPS-3. The box plot description is as described for Fig. 1. Groups: A, PNC-3 in RV given i.n.; B, PPS-3 in RV given i.n.; C, PNC-3 in saline given i.n.; D, PPS-3 in saline given i.n.; E, PNC-3 in FCA or FIA given i.p.; F, nonimmunized control.

