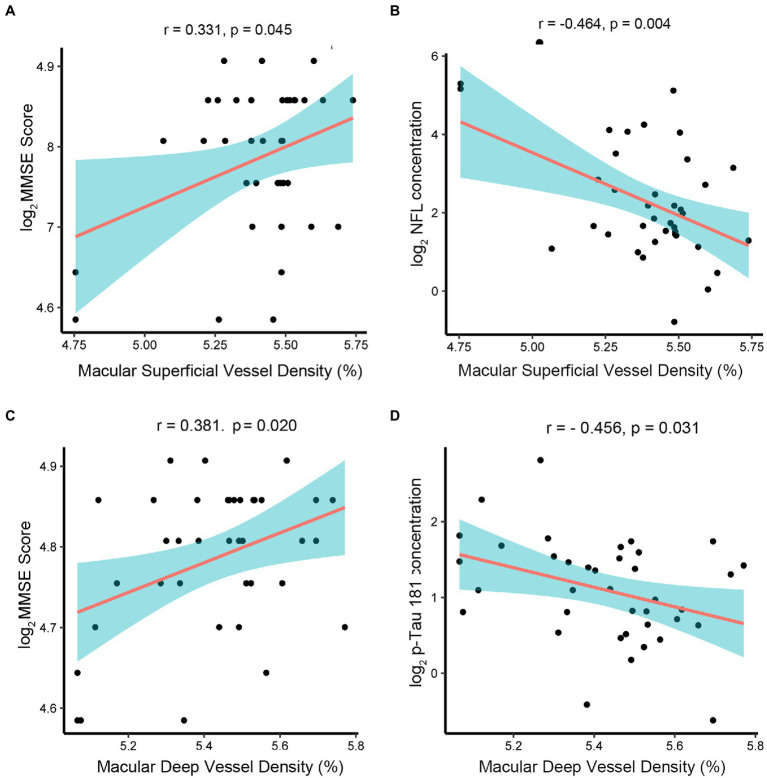
Figure 4.
Associations between retinal thickness, retinal vessel density, and AD-related proteins in AMD group. The AD-related biomarkers concentrations and MMSE scores were log-transformed. p < 0.05 was considered statistically significant. The blue area represented the 95% confidence interval. (A,B) The macular whole enface superficial vessel density values had a positive correlation with MMSE scores (r = 0.331, p = 0.045) but a negative correlation with the concentration of NfL (r = −0.464, p = 0.004). (C,D) The macular whole enface deep vessel density values were positively correlated with MMSE scores (r = 0.381, p = 0.020) and negatively correlated with the concentration of p-tau181 (r = −0.456, p = 0.031).

