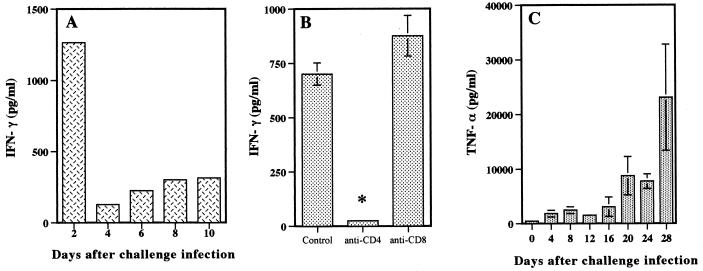
FIG. 4.
IFN-γ and TNF-α production during the course of challenge infection with B. microti. (A) Spleen cells from immune mice were cultured with B. microti lysate antigen, and IFN-γ concentrations were measured in supernatants at 72 h. (B) Spleen cells from mice treated with MAb against CD4+ or CD8+ T cells were cultured as described for panel A. (C) Serum samples were collected on the indicated days for determination of TNF-α production in the serum of mice. Error bars indicate standard errors of the means. An asterisk indicates a significant difference (P < 0.01) between anti-CD4 MAb-treated and control groups. Data are representative of two separate experiments.

