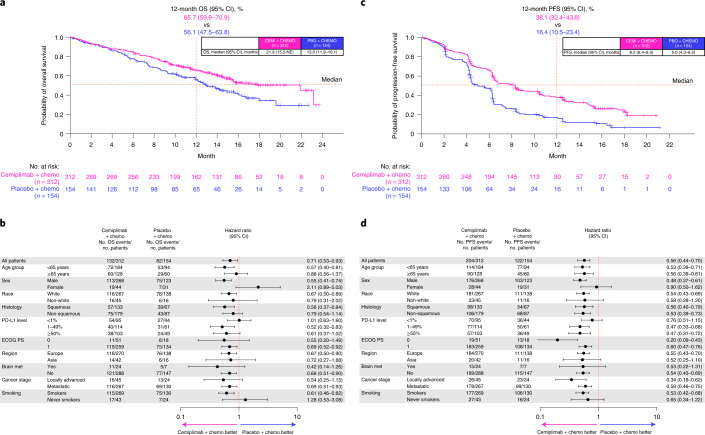
Fig. 2. Survival data for the cemiplimab plus chemotherapy and placebo plus chemotherapy arms.
a, Kaplan–Meier OS curves of all patients. b, Forest plots of OS by subgroups. c, Kaplan–Meier PFS curves of all patients. d, Forest plots of PFS by subgroups. Median OS and PFS and corresponding two-sided 95% CIs were estimated by the Kaplan–Meier method. HRs and corresponding two-sided 95% CIs for OS and PFS were calculated using a stratified Cox proportional hazard model with Efron’s method of tie handling. Cemi, cemiplimab; chemo, chemotherapy; met, metastasis; PBO, placebo.

