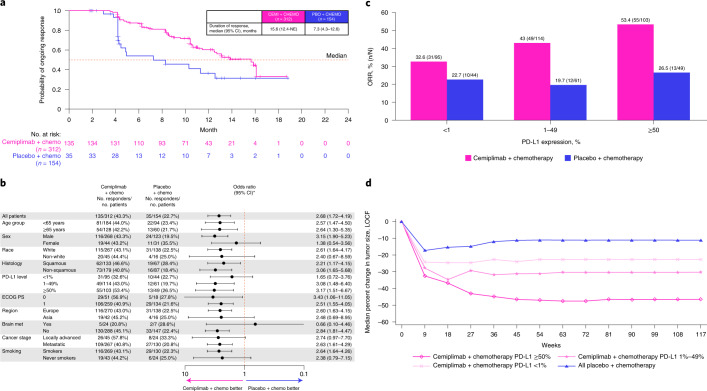
Fig. 3. Tumor response data for the cemiplimab plus chemotherapy and placebo plus chemotherapy arms.
a, Kaplan–Meier curves of DOR in all patients. The median DOR and corresponding two-sided 95% CI were estimated by the Kaplan–Meier method. b, Forest plots of objective response in pre-specified subgroups. Odds ratios and corresponding two-sided 95% CIs were calculated using the Cochran–Mantel–Haenszel method. c, ORR in correlation with baseline PD-L1 levels. ORR and the corresponding two-sided 95% CI were calculated using the Clopper–Pearson method. d, Tumor response in correlation with baseline PD-L1 levels. Median percent change in tumor size over time was calculated descriptively (LOCF). Cemi, cemiplimab; chemo, chemotherapy; LOCF, last observation carried forward; met, metastasis; PBO, placebo.

