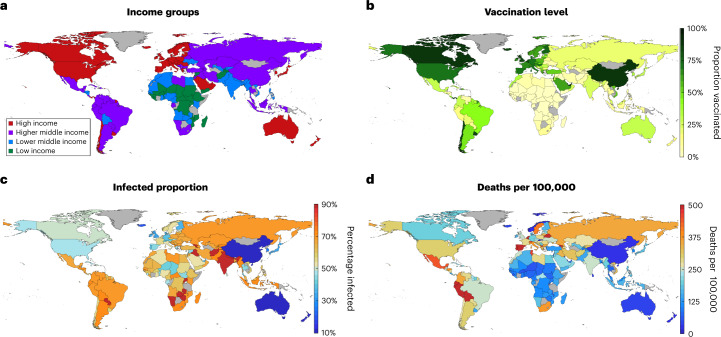
Fig. 1. Reference maps for the current, low sharing scenario at the start of 2022.
a, Income group for each country simulated as defined by the World Bank. b, Proportion of each simulated country having received full vaccination (two doses). c, Estimated proportion of each simulated country to have been infected by SARS-COV-2. d, Estimated total number of deaths per 100,000 due to COVID-19 in each simulated country. In each, gray shading indicates a country that has not been simulated.

