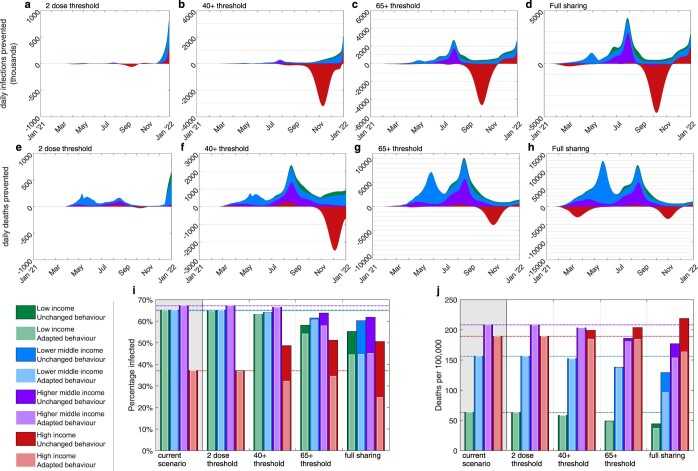
Extended Data Fig. 5. Relative changes over time and total infections and mortality in each economic region for scenarios with age biased vaccine distribution.
Plots presenting estimates based on scenarios with age biased vaccine redistribution. Panels a-h show time series plots showing the reduction (positive values) or increase (negative values) in the global number of daily infections and daily deaths compared to the default scenario, each assuming un-adapted behaviour. Panels i and j show estimated total proportion infected and deaths from COVID-19 per 100,000 respectively until the start of 2022 (so over all of 2020 and 2021) in each of the economic regions. All results represent medians of 100 simulations with model fitting spanning the range of uncertainty in infection and mortality estimates for each country. These are presented as caricatures to compare scenario impact with detailed data and associated prediction intervals provided in Supplementary Tables 7 and 8.

