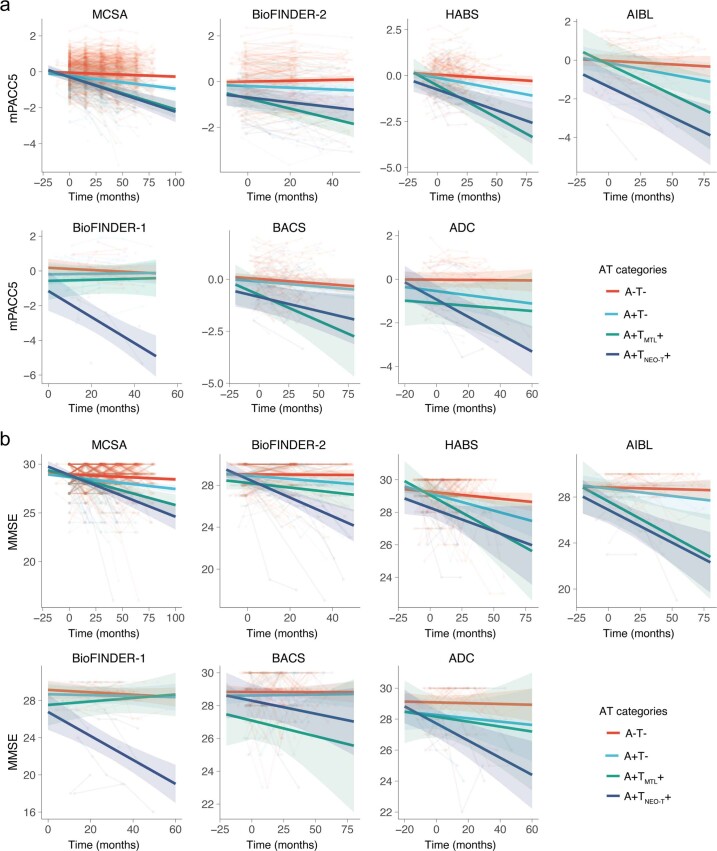
Extended Data Fig. 3. Cognitive decline on mPACC5 and MMSE in the individual cohorts.
a, Cognitive trajectories of mPACC5 scores over time in the different AT categories in each individual cohort. b, Cognitive trajectories of MMSE scores over time in the different AT categories in each individual cohort. The average regression line for each group was plotted from linear mixed effect models including age, sex, and education as covariates. The error bands correspond to the 95% confidence interval. Data are anchored to the tau-PET visit (Time 0), and cognitive data up to 1 year prior to PET was included.

