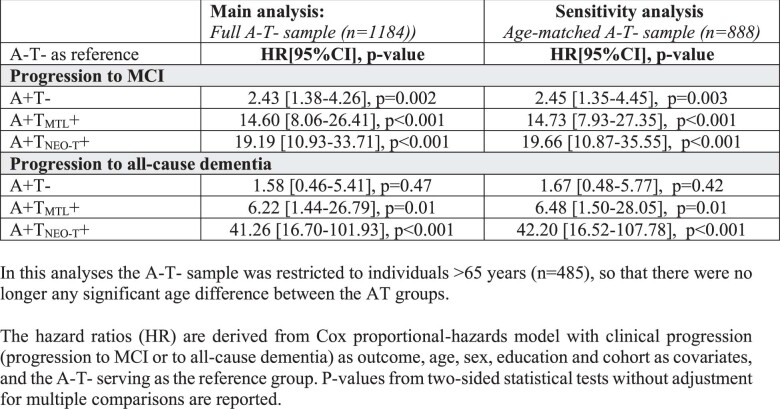
Extended Data Table 4.
Survival analyses for the full A-T- sample versus an age-matched A-T- sample. In this analysis, the A-T- sample was restricted to individuals older than 65 years (n = 485), so that there was no longer any significant age difference between the AT groups. The hazard ratios are derived from a Cox proportional-hazards model with clinical progression (progression to MCI or to all-cause dementia) as the outcome and age, sex, education and cohort as covariates; A−T− served as the reference group. P values from two-sided statistical tests without adjustment for multiple comparisons are reported

