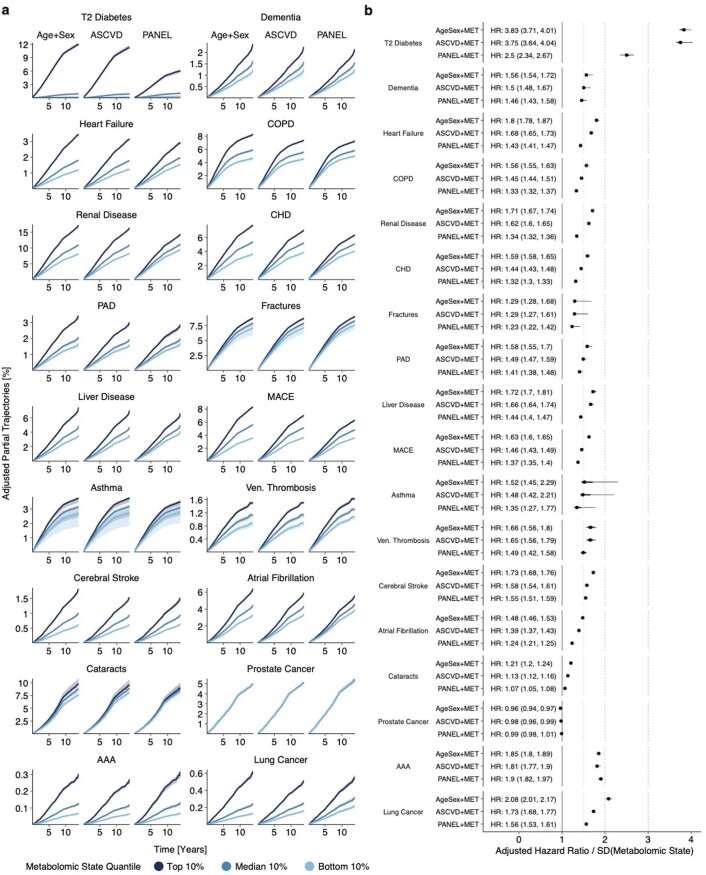
Extended Data Fig. 6. Adjusted effect of the metabolomic state is endpoint dependent.
a) Adjusted trajectories representing the partial cumulative risk dependent on the metabolomic state over time for the endpoints where the metabolomic state added information to the Age+Sex baseline (see Fig. 3b) for the bottom (light blue), median (blue), and top (dark blue) 10% metabolomic state quantiles. The shaded area indicates the 95% confidence interval as estimated by bootstrapping over 1000 iterations. b) Adjusted hazard ratios (HRs) for the metabolomic state in combination with the three clinical predictor sets. A unit standard deviation increase in the metabolomic state corresponds to an HR increase in predicted risk. Statistical measures were derived from n = 117.981 individuals. Individuals with prior events were excluded (Supplementary Table 1). Data are presented as median (center of error bar) and 95% CI (line of error bar) determined by bootstrapping with 1000 iterations.

