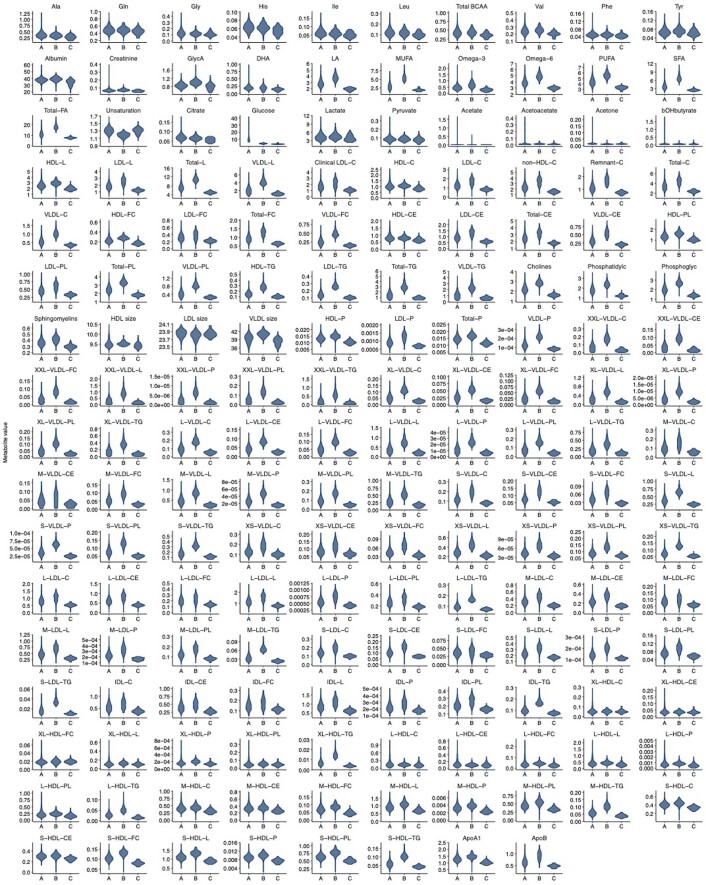
Extended Data Fig. 10. Metabolites differ throughout the attribution space.
Displayed are distributions for all measured metabolites (n = 168) stratified by the region (A, B, and C) in the attribution space, defined by the UMAP of the attributions for T2D (see Extended Data Figure 9c). Regions were defined by including all samples with an euclidean distance < 1 to the centroid A, B, and C, respectively; a Euclidean distance of 1 is indicated by the scale bar (see Extended Data Figure 9c). The distributions differ notably for metabolites, including glucose, fatty acids (that is LA and Omega-6), and multiple lipoprotein components (that is VLDL cholesterol and very large HDL triglycerides).

