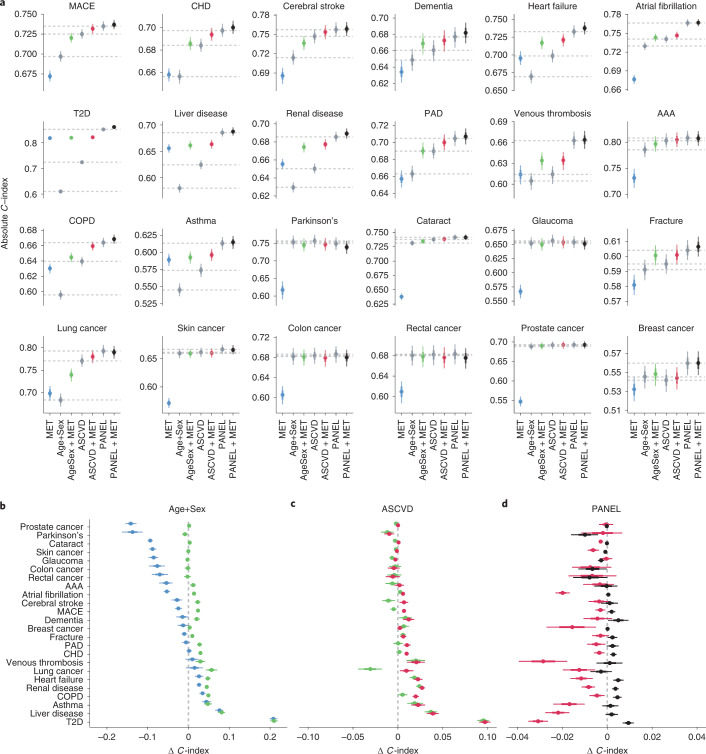
Fig. 3. Predictive value of the metabolomic state is endpoint dependent.
a, Comparison of discriminative performance of CPH models trained on the metabolomic state only (MET), the three clinical predictor sets (Age+Sex, ASCVD and PANEL) and the sets’ combinations with the metabolomic state. Horizontal dashed lines indicate the median performance of the three clinical predictor sets. b, Differences in discriminative performance between the Age+Sex baseline (dashed line), metabolomic state only (blue) and the combination of Age+Sex and metabolomic state (green). c, Differences in discriminative performance between ASCVD predictors (dashed line), the combination of Age+Sex and the metabolomic state (green) and the combination of metabolomic state and ASCVD predictors (red). d, Difference in discriminative performance between comprehensive PANEL predictors (dashed line), ASCVD + MET (red) and PANEL + MET (black). a–d, Statistical measures were derived from n = 117.981 individuals; those with previous events were excluded (Supplementary Table 1). Data are presented as median (center of error bar) and 95% CI (line of error bar) determined by bootstrapping of with 1,000 iterations. b–d, The x-axis range differs across panels; vertical grid lines indicate differences of 0.02 C-index.

