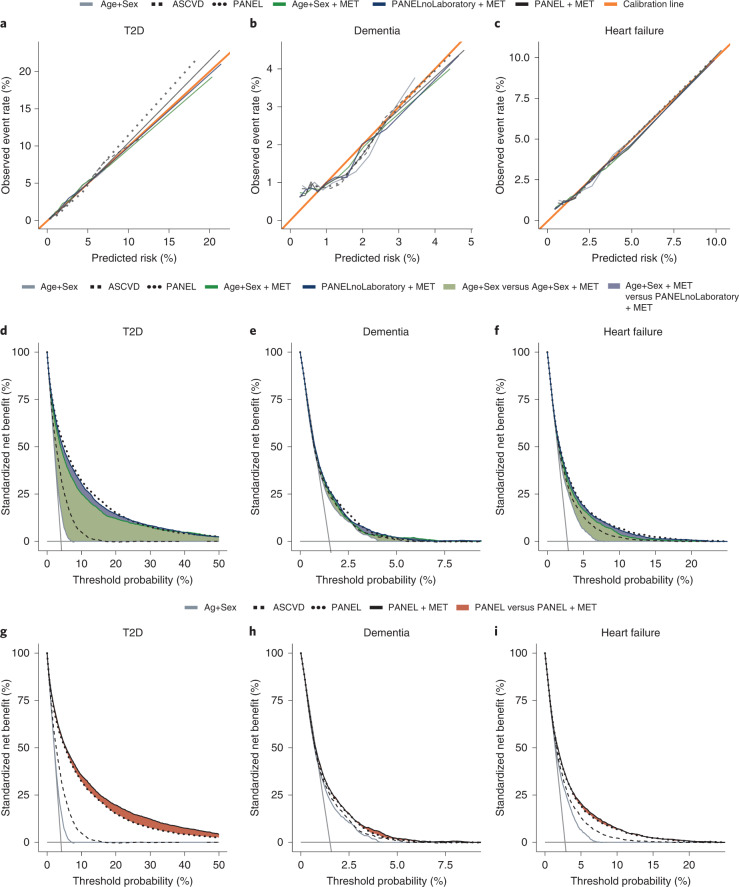
Fig. 4. Model calibration and additive predictive value of the metabolomic state translate to potential clinical utility.
a–c, Calibration curves for CPH models, including baseline parameter sets Age+Sex, ASCVD and PANEL, as well as their combinations with the metabolomic state (Age+Sex + MET) for the endpoints T2D (a), dementia (b) and heart failure (c). d–f, Endpoint-specific net benefit curves standardized by endpoint prevalence, where horizontal solid gray lines indicate ‘treat none’ and vertical solid gray lines indicate ‘treat all’; T2D (d), dementia (e) and heart failure (f). The standardized net benefits of sets Age+Sex, ASCVD and PANEL are compared with Age+Sex + MET and additional non-laboratory predictors of PANEL (PANELnoLaboratory). Green and blue color-filled areas indicate the added benefit of the combination of the metabolomic state and Age+Sex and PANELnoLaboratory, respectively. g–i, Standardized net benefit curves comparing the performance of PANEL + MET against baselines Age+Sex, ASCVD and PANEL; T2D (g), dementia (h) and heart failure (i). Decision curves were derived from n = 111,745 (T2D), n = 117,245 (dementia) and n = 113,636 (heart failure) individuals.

