
Figure 3.
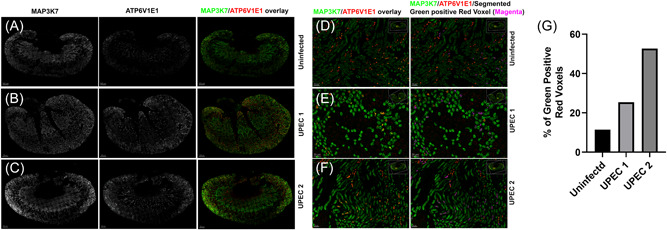
MAP3K7 confocal imaging. C57BL/6 mice were challenged with UPEC in vivo for 1 h or remain uninfected. Kidney sections were stained with MAP3K7 (Green) and ATP6V1E1 (Red) to locate ICs and acquired on confocal imaging microscope. 20× whole kidney image stitch was performed, and quantification was done using imaris software. (A–C) MAP3K7 (left panel) and ATP6V1E1 (middle panel) is shown in greyscale and overlay of MAP3K7 (Green) expressing IC (Red) (right panel). (D–F) Enlarged inset images of MAP3K7 and ATP6V1E1 overlay (left panel) and overlay plus segmented red plus green expressing IC in pseudocolor magenta (right panel). (G) Imaris quantification of % MAP3K7 expressing IC. Scale bar (A–C) 500 µm, Scale bar (D–F) 50 µm. IC, intercalated cell; UPEC, uropathogenic Escherichia coli.