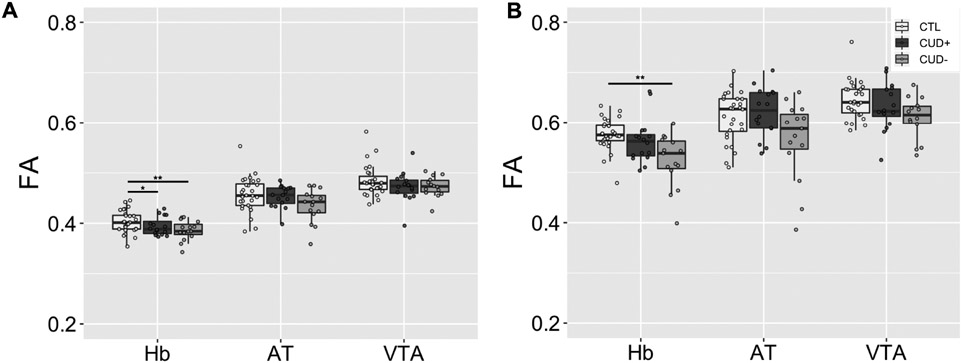
Figure 4.
Group comparisons of FA averaged across the entire tract (A) and within the ALIC subsection (B). *p < .05, **p < .01, ***p < .001. FA = fractional anisotropy; Hb = habenula; AT = anterior thalamus; VTA = ventral tegmental area; CTL = control individuals; CUD+ = currently using cocaine-addicted individuals; CUD− = short-term abstinent cocaine-addicted individuals. Boxplots represent the median (center line), interquartile range (box), and 1.5x the interquartile range (whiskers).

