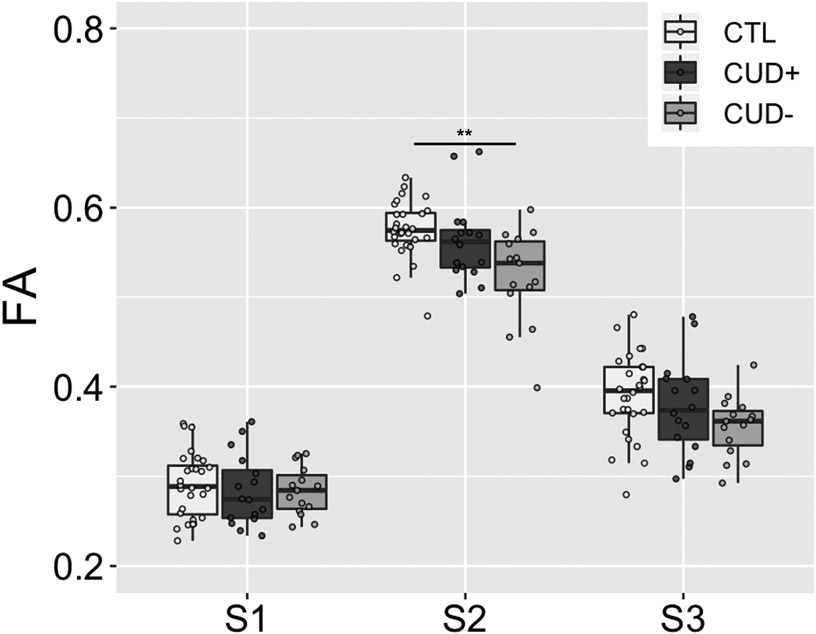
Figure 5.
Group comparison of FA in subsections S1, S2, and S3 of the PFC-Hb tract. FA = fractional anisotropy; CTL = control individuals; CUD+ = currently using cocaine-addicted individuals; CUD− = short-term abstinent cocaine-addicted individuals. Boxplot represents the median (center line), interquartile range (box), and 1.5x the interquartile range (whiskers). Note that S2 in this figure and Figure 4B Hb show the same data.

