
Figure 4.
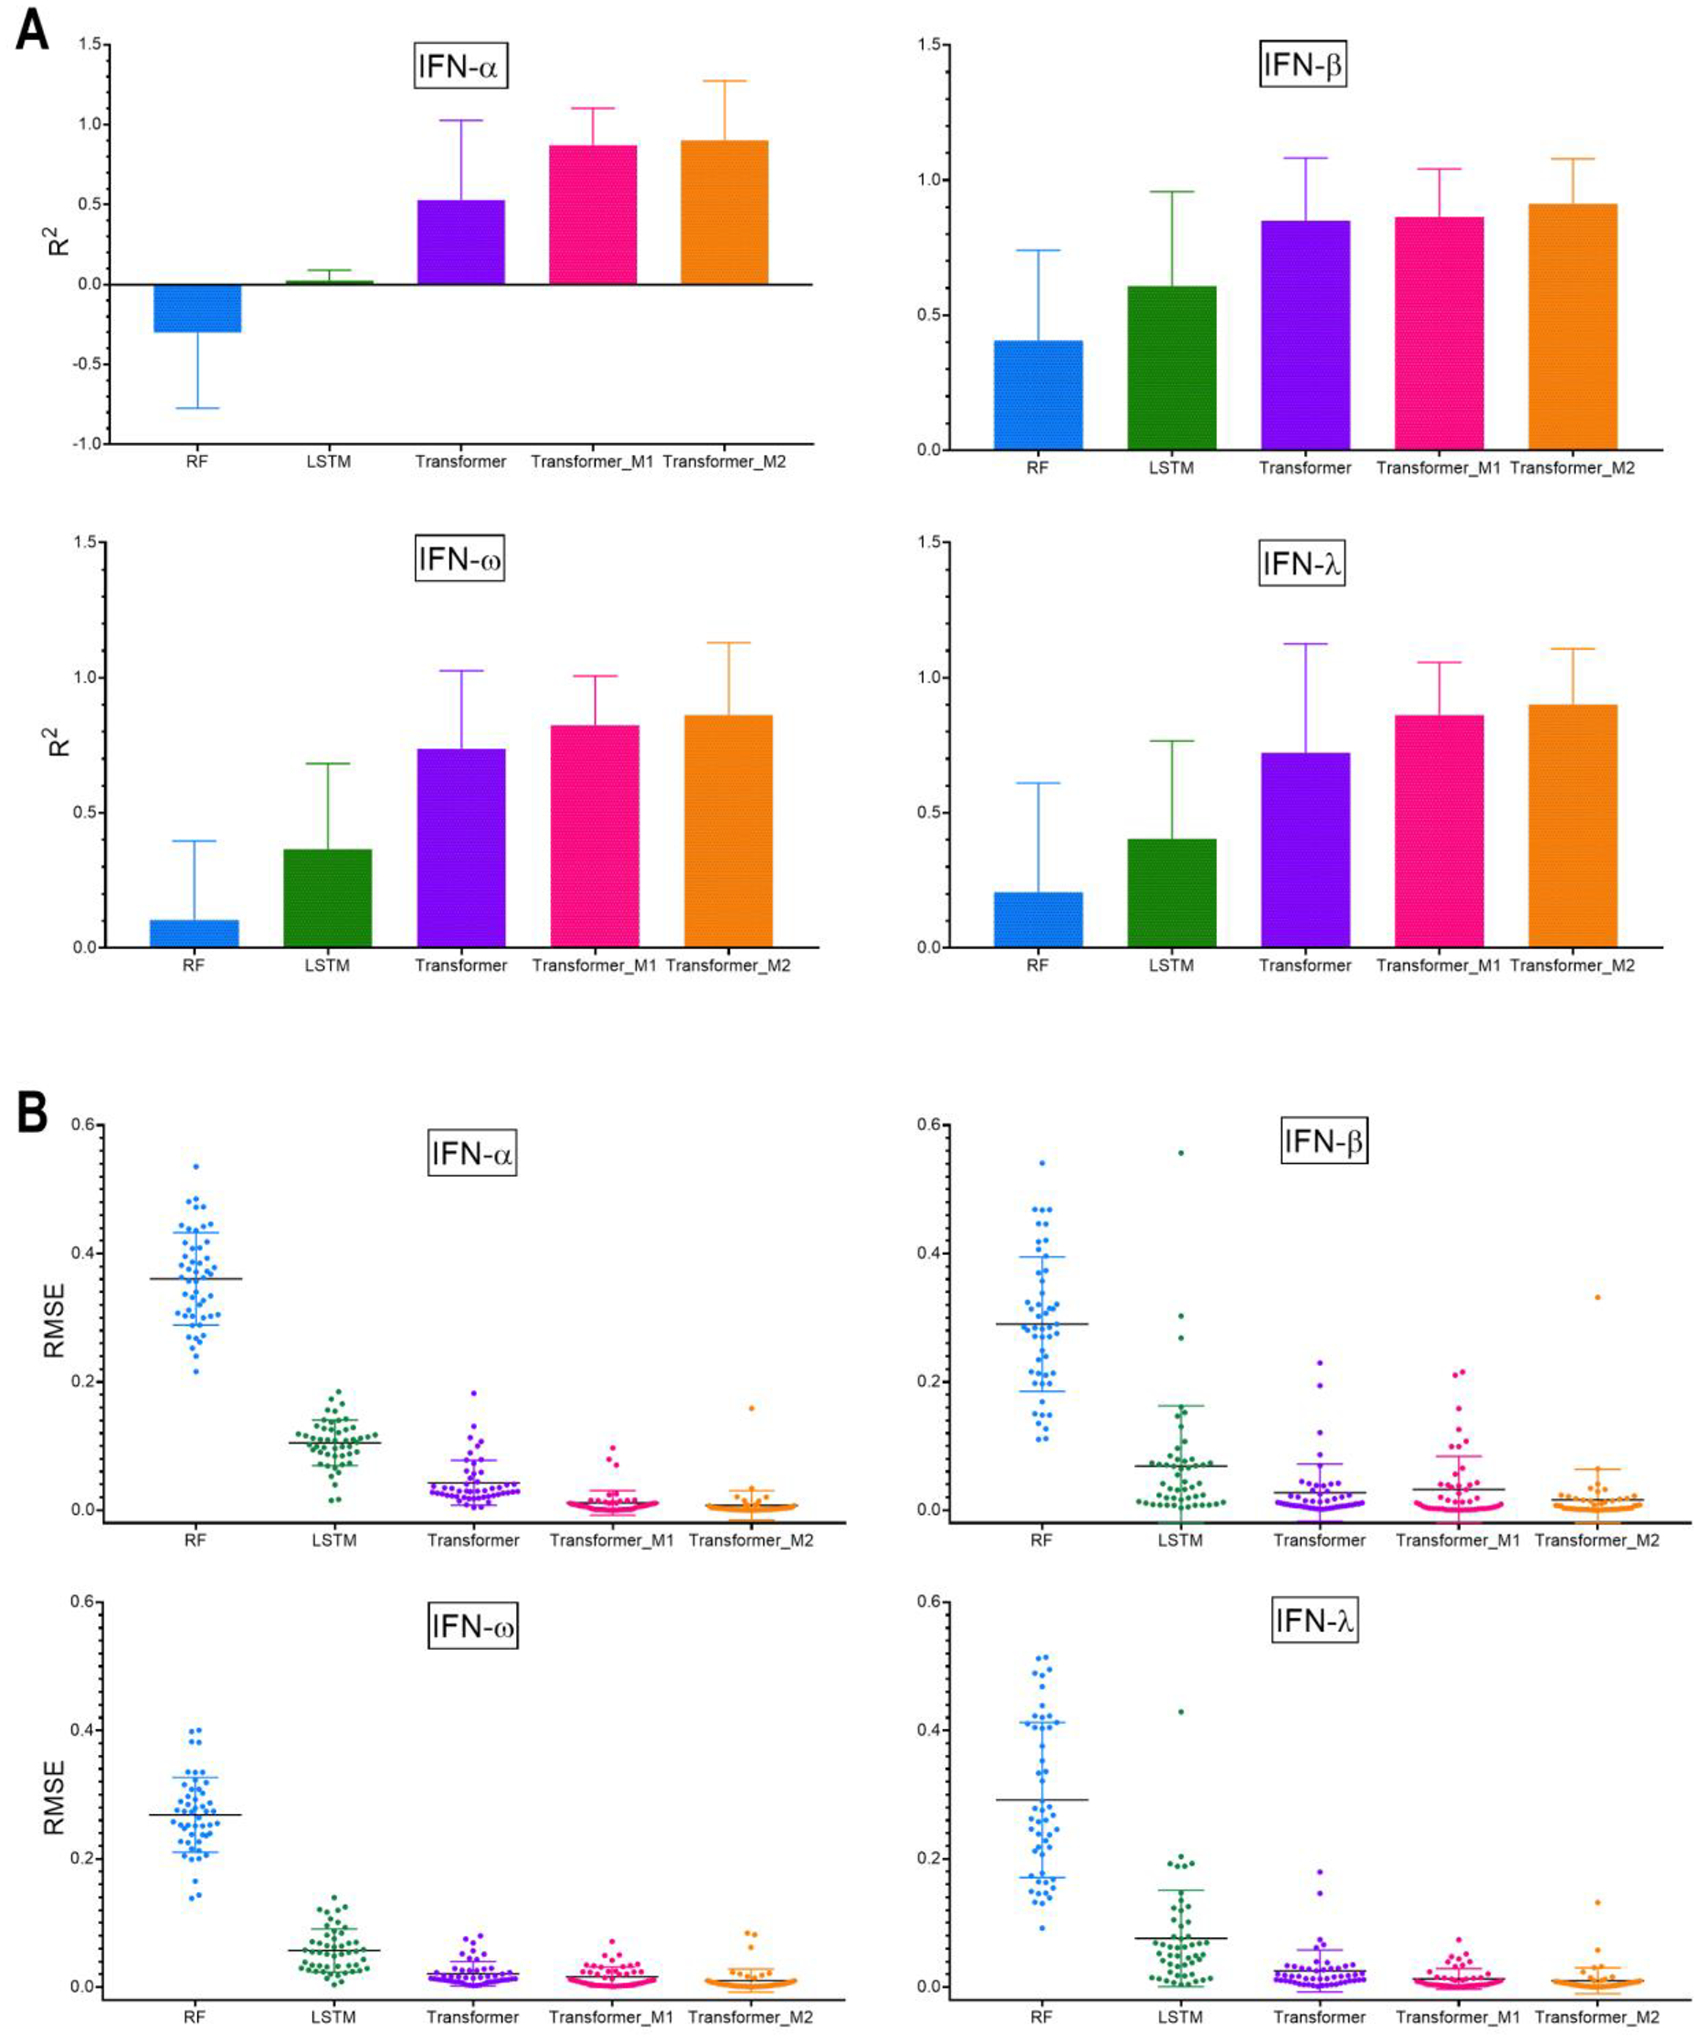
Average performance (A) R2 and (B) RMSE for different modeling approaches over 5-fold cross-validation and repeated 10-times. The error bar represents the standard deviation of the average performance over 5-folds cross-validation repeated 10-times (n=50). Detailed statistical analysis is shown in SI Table S5.