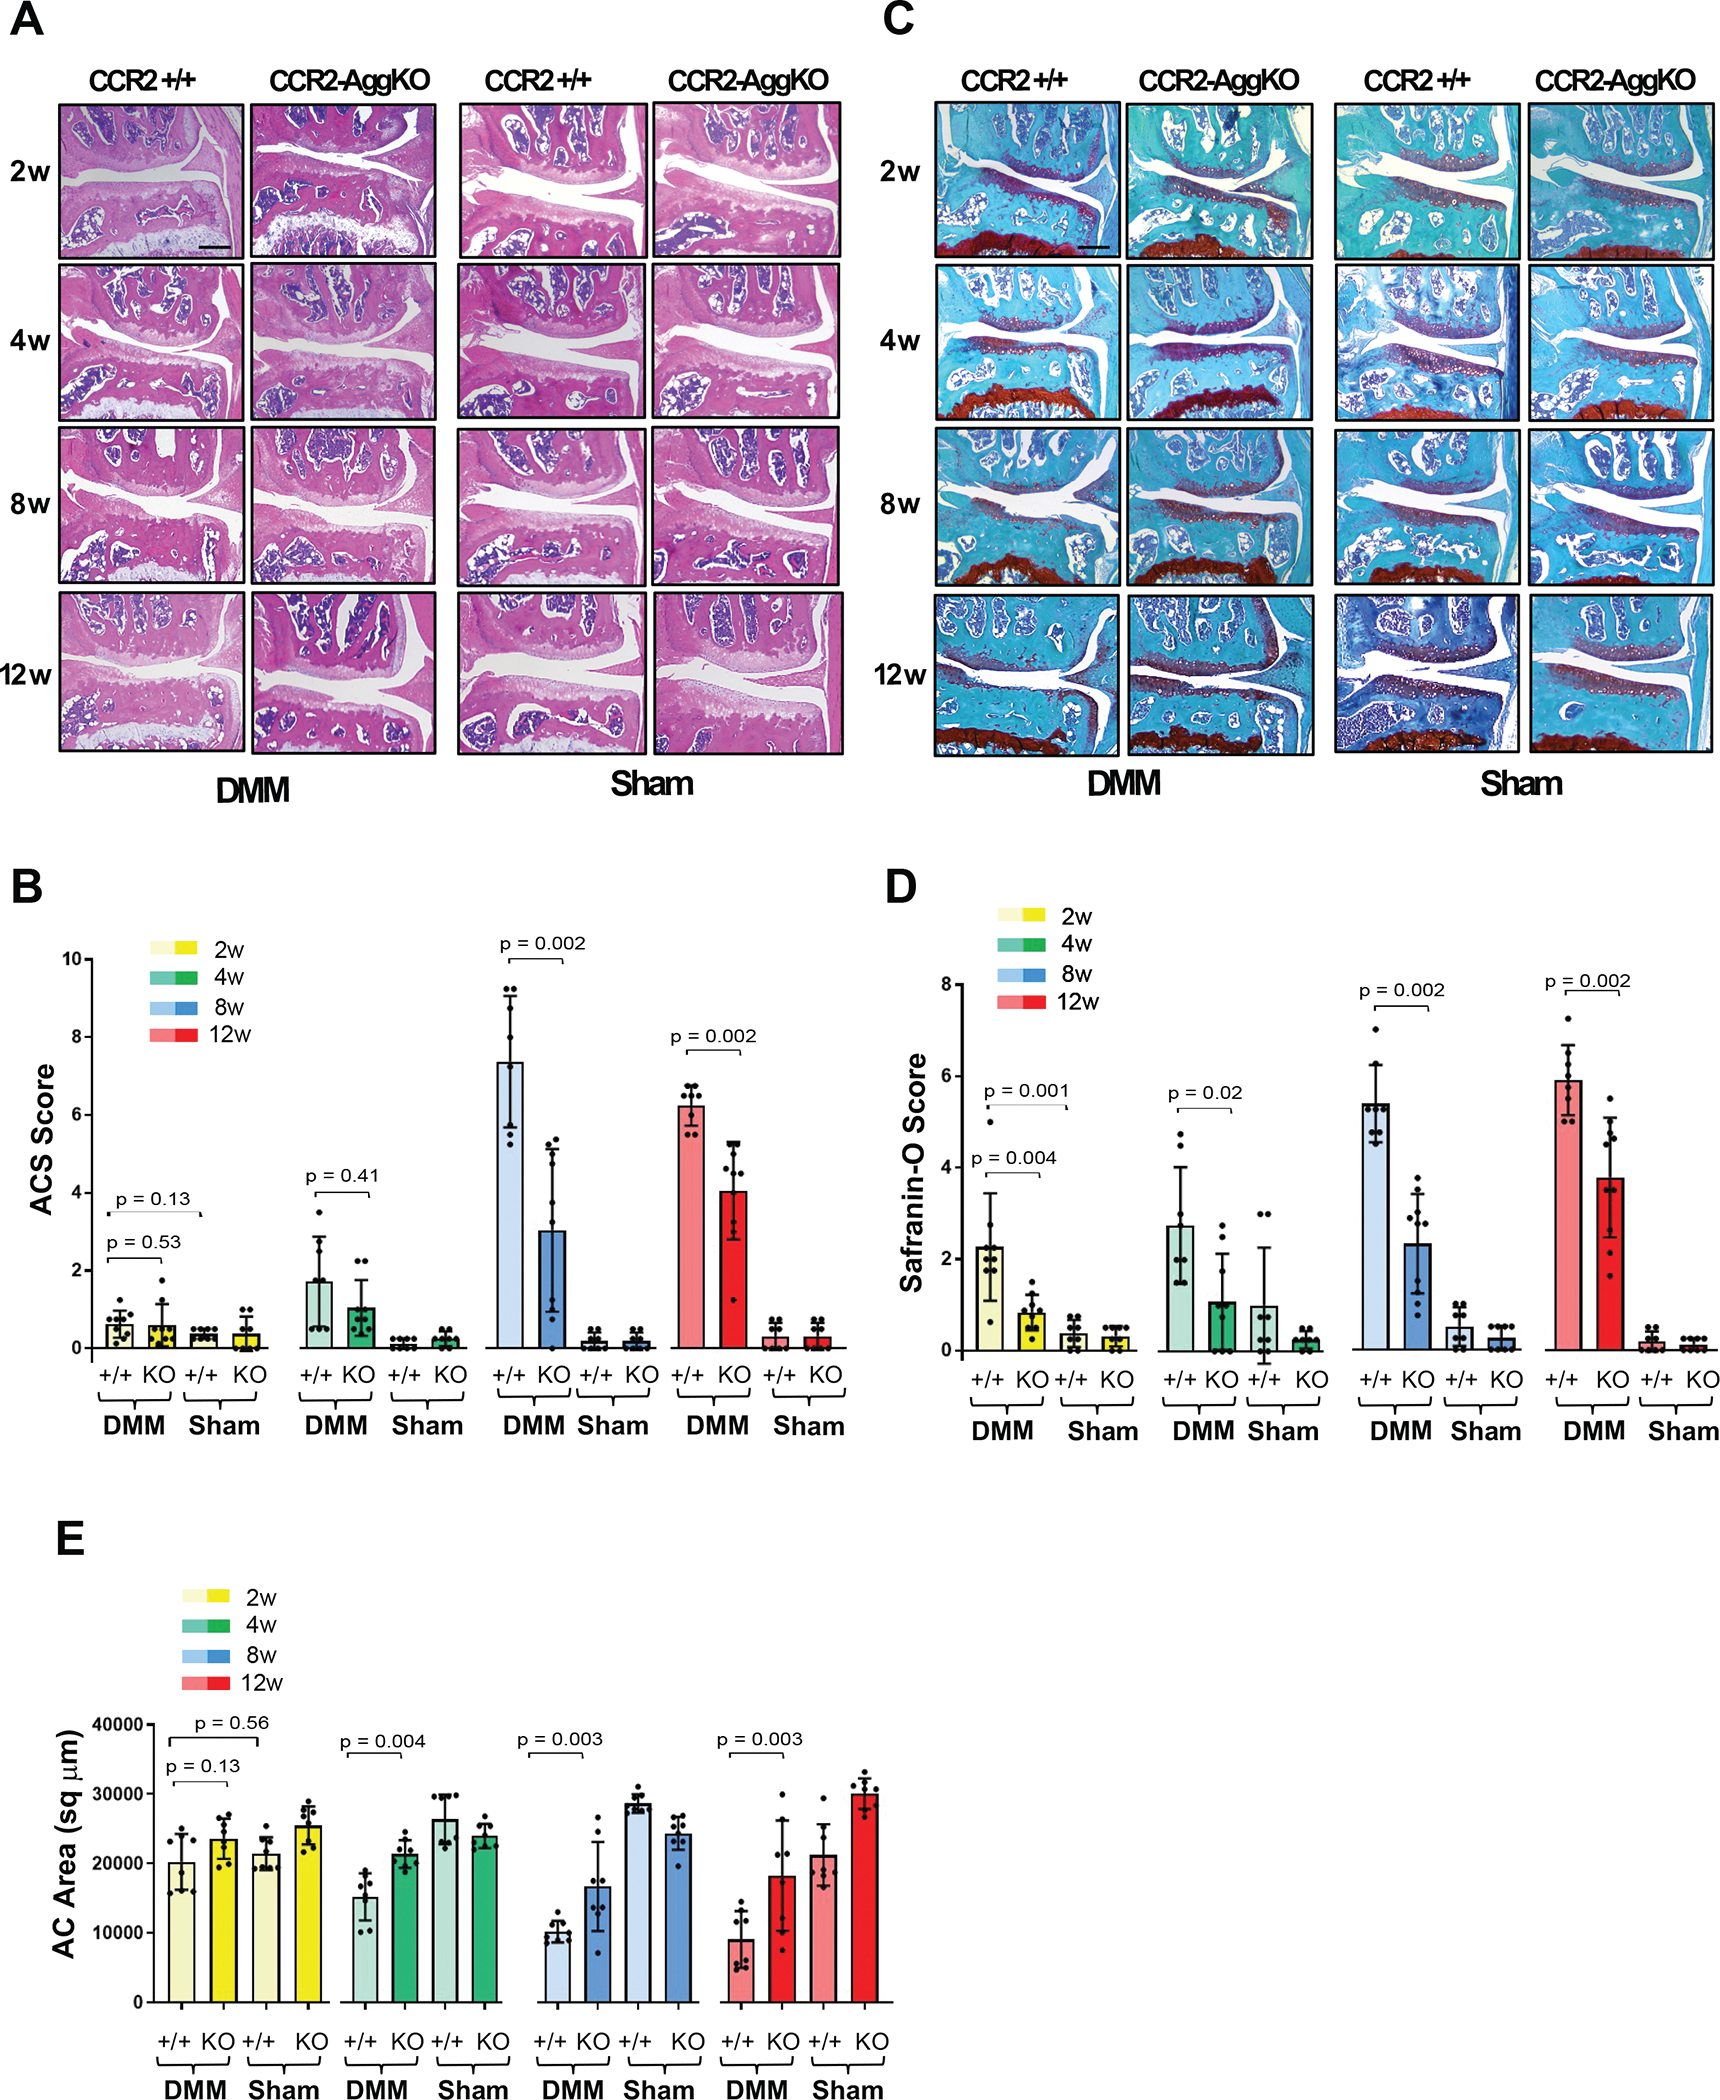
Figure 2. Histopathological evaluation of CCR2-AggKO and CCR2+/+ mouse knees, following early CCR2 inactivation.

(A) H&E staining of the knee medial compartment from CCR2-AggKO and CCR2+/+ mice after DMM/Sham (time indicated); images are representative of N=8 for each time point. (B) ACS score (0–12 scale) of DMM/Sham knees at the time point indicated. Results are expressed as average of 4 quadrants (medial and lateral tibial plateau, medial and lateral femoral condyles); N=8 mice for each experimental point. (C) Safranin-O/Fast green staining of the knee medial compartment after DMM/Sham (time indicated); images are representative of N=8 for each time points. (D) Safranin-O staining Score (0–12 scale) of DMM/Sham knees at the time point indicated. Results are expressed as average of 4 quadrants as described above; N=8 mice for each experimental point. (E) Quantification of the AC area (sq μm) of the medial plateau of DMM/Sham knees by histomorphometric analysis at the time point indicated; N=8 mice for each experimental point. The graphs represents the mean ± standard deviation Indicated p-values were determined by Wilcoxon rank sum tests at each time point, following adjustment for multiple comparisons. Scale bars of the images are 100 μm.
