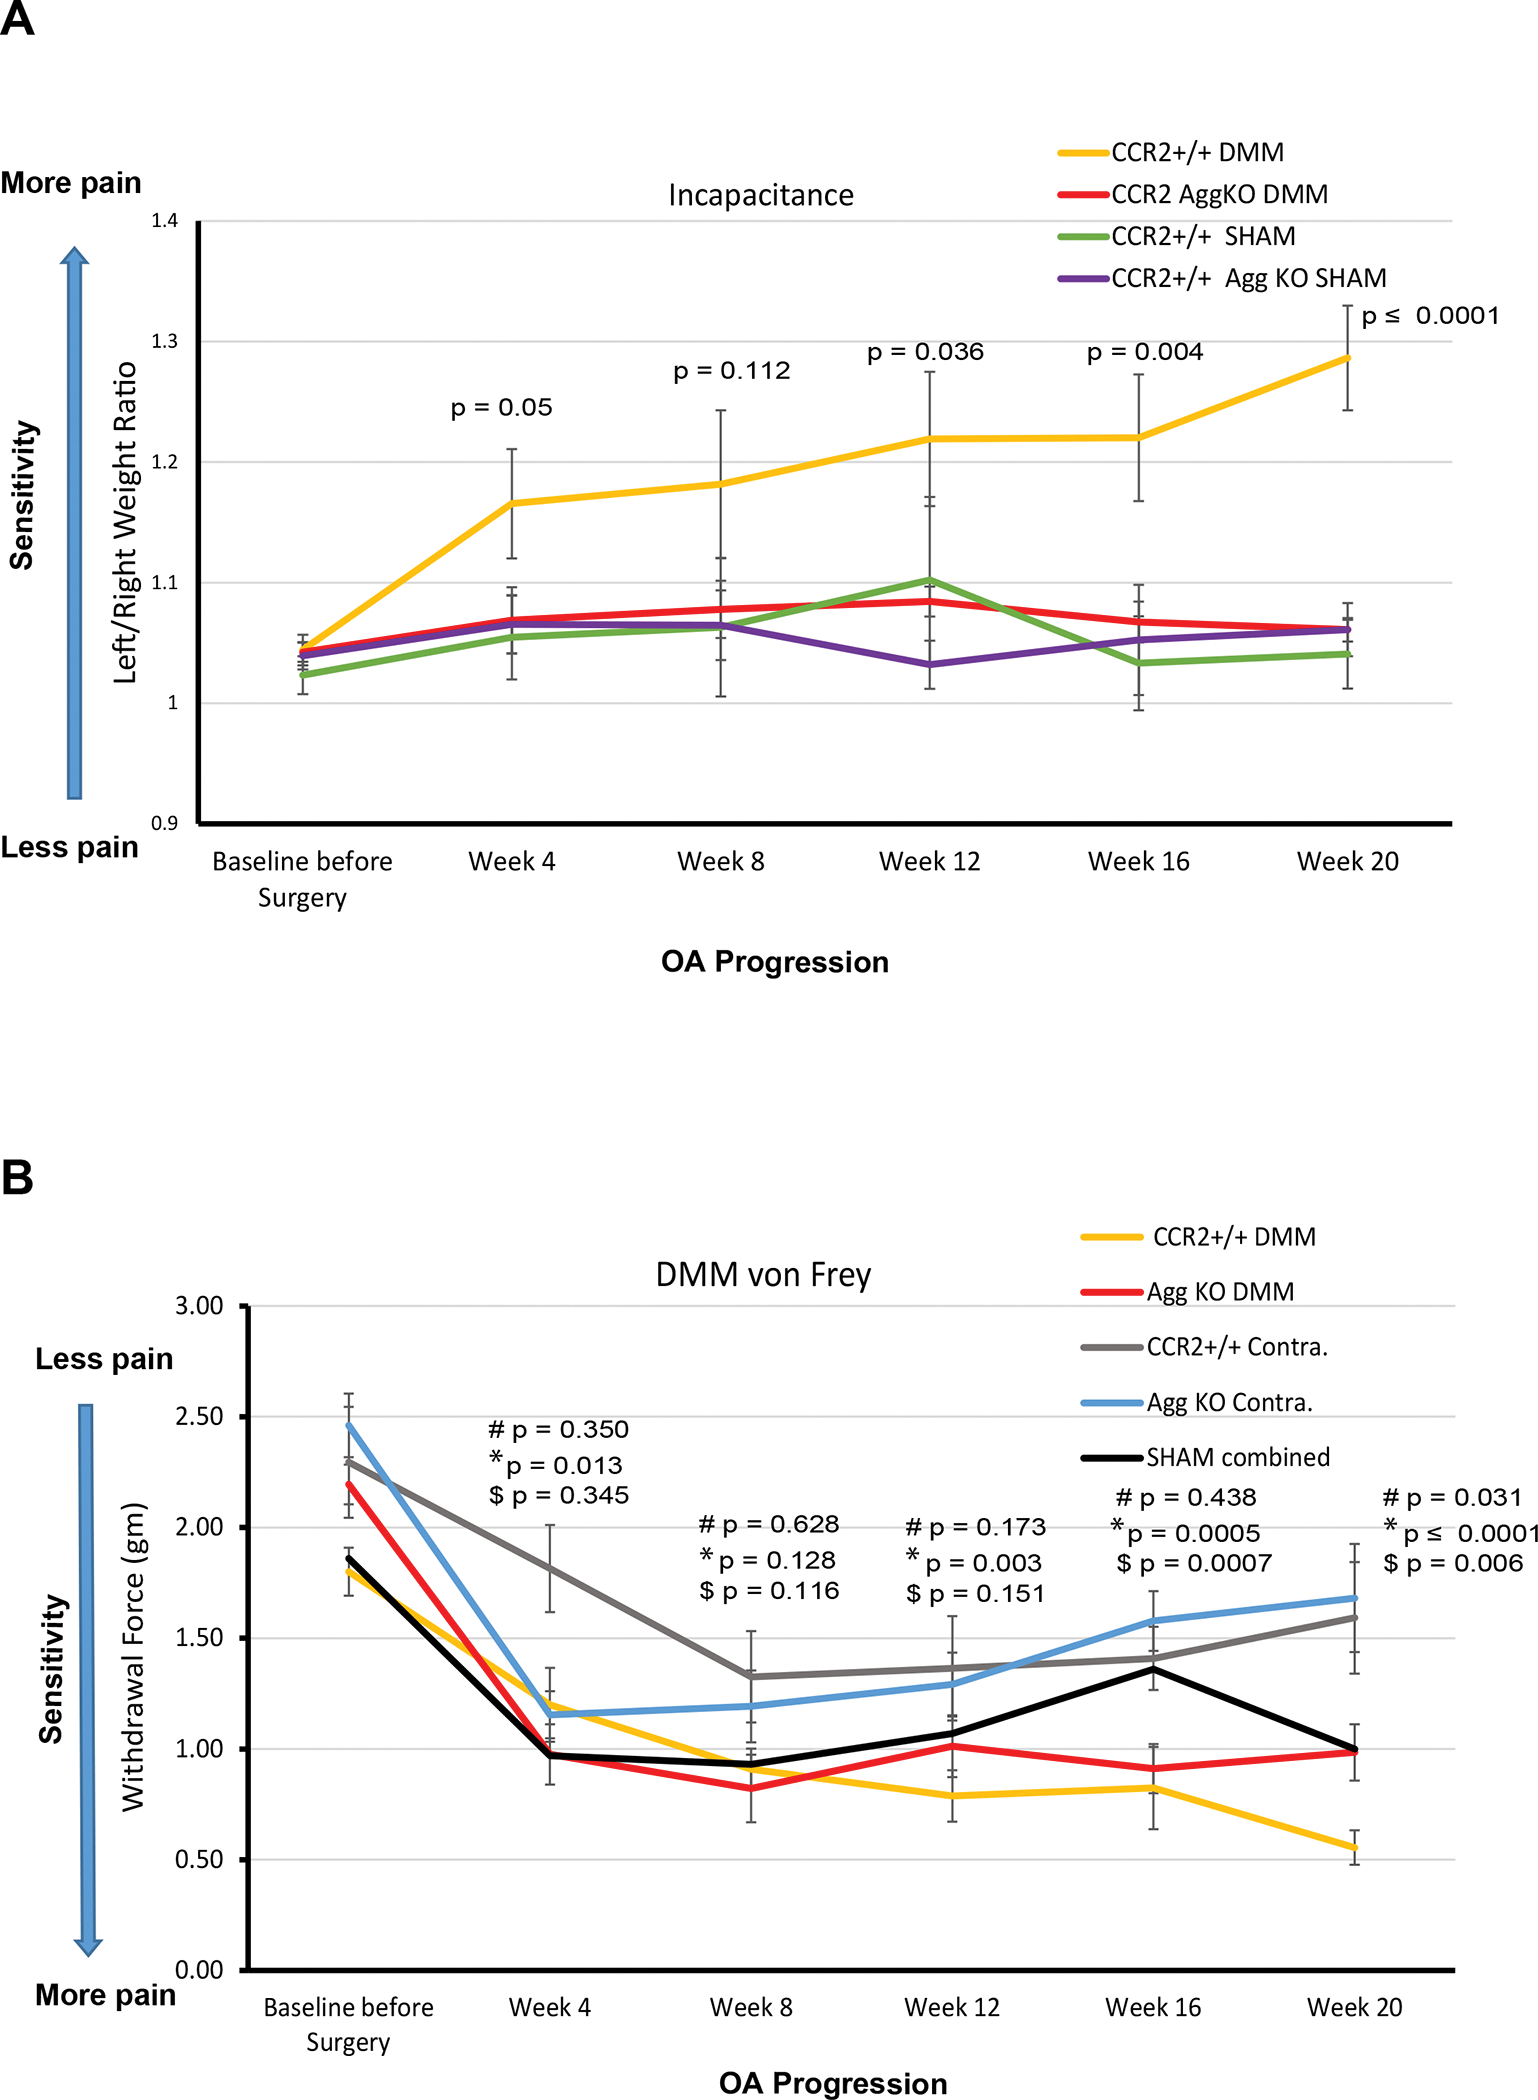
Figure 6. Pain assessment of CCR2-AggKO and CCR2+/+ mice, following early CCR2 inactivation.

(A) Weight bearing longitudinal measures of CCR2-AggKO and CCR2+/+ mice were assessed at the indicated time points after DMM or Sham (N=9). Baseline measures were obtained before DMM/Sham and before CCR2 recombination. The graph represents observed mean scores by group and time point; error bars indicate the SEM by group and time point. Indicated p-values were determined for differences between corresponding groups by linear mixed effects model (LMM) as described in Statistical Analysis section. Numerical summaries of LMM are provided in details in Table-1 and Supplemental Table-S3. (B) Evoked pain (von Frey) was longitudinally assessed in CCR2-AggKO and CCR2+/+ mice in both the operated (DMM leg) and the un-operated limb (Contralateral), at the indicated time points after DMM (N=9). Baseline measures were obtained before DMM/Sham and before CCR2 recombination. Shams measures have been combined at each time point and the average is indicated by a black line (N=12). The graph represents observed mean scores by group and time point; error bars indicate the SEM. Indicated p-values were determined for differences between corresponding groups by LMM as described in Statistical Analysis section. Numerical summaries of LMM are provided in details in Table-1 and Supplemental Table-S4 : # indicates differences in values between DMM CCR2+/+ and DMM CCR2-AggKO mice (yellow line vs red line); *represents differences in values between the DMM and its Contralateral leg in CCR2+/+ mice (yellow line vs gray line, respectively), at the time point indicated; $ represents differences in values between the DMM and its Contralateral leg in CCR2-AggKO mice (red line vs blue line, respectively), at the time point indicated.
