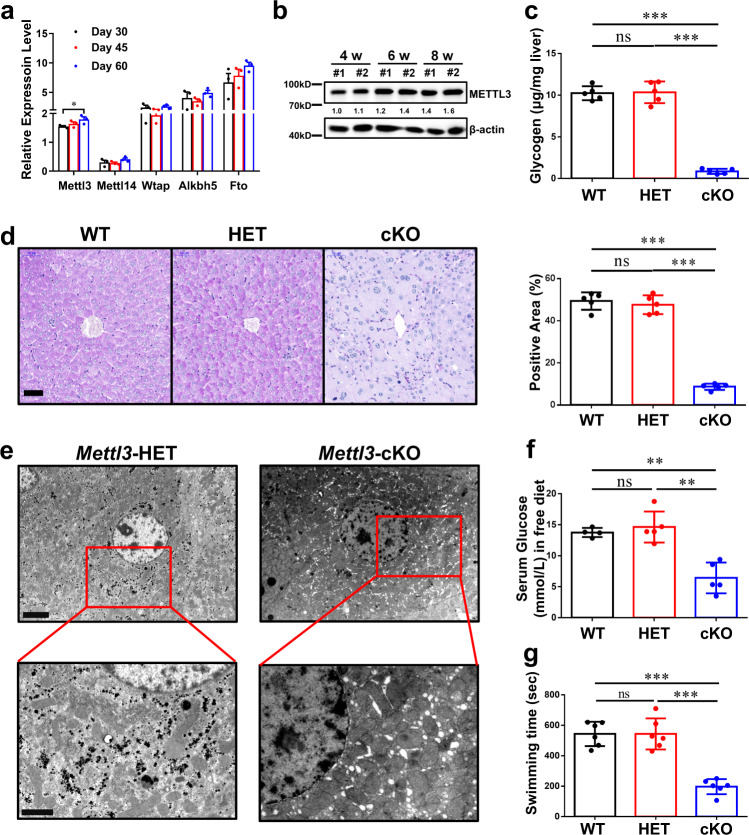
Fig. 2. Mettl3 depletion simulates lack of glycogen in liver.
a Relative expression levels (FPKM) of five key genes in m6A writing or erasing from a mouse liver-associated GEO dataset (GSE58827). n = 3 independent samples. Data are presented as mean values +/− SEM. Two-way ANOVA was performed to determine a difference among columns within a gene. *p < 0.05. b Western blotting assay of Mettl3 protein level in wild-type mouse livers from different ages. This experiment was repeated independently with similar results at least 3 times. c Hepatic glycogen content at different ages, as micrograms per milligram of tissue, n = 5 animals. Data are presented as mean values +/− SEM. One-way ANOVA was performed to determine a difference between each column. ns, not significant; ***p < 0.001. d PAS staining of livers in 8-week-old mice with different Mettl3 genotypes. The percentage of positive area is measured by Image J and shown on the right. WT wild type, HET heterozygous, cKO conditional knockout (Albumin-cre). Bar, 50 μm. n = 5 animals. Data are presented as mean values +/− SEM. One-way ANOVA was performed to determine a difference between each column. ns, not significant; ***p < 0.001. e Transmission electron microscope pictures of livers in 8-week-old mouse with indicated Mettl3 genotypes. Bar: top, 4 μm; bottom, 2 μm. This experiment was repeated independently with similar results at least 3 times. f Serum glucose level of 8-week-old mice with different Mettl3 genotypes. n = 5 animals. Data are presented as mean values +/− SEM. One-way ANOVA was performed to determine a difference between each column. ns, not significant; **p < 0.01. g Exhaustive swimming assay of 8-week-old mice with different Mettl3 genotypes. n = 6 animals. Data are presented as mean values +/− SEM. One-way ANOVA was performed to determine a difference between each column. ns, not significant; ***p < 0.001. Source data are provided as a Source data file. See also Supplementary Figs. 1 and 2.

