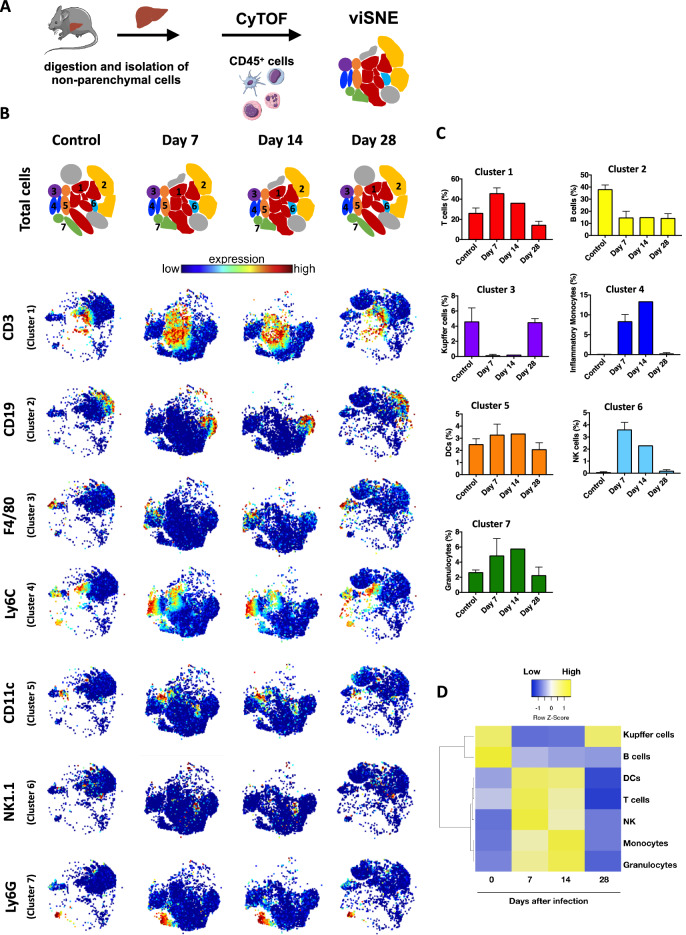
Figure 2.
Identification of liver immune cells by CyTOF. (A) Schematic representation of liver nonparenchymal cells and clustering after CyTOF Cytobank analysis. The scheme was partly generated using Sevier Medical Art, provided by Sevier, licensed under a Creative Commons Attribution 3.0 unported license. (B) Representation of viSNE analysis showing clusters and the expression of several different surface markers that enable the distinction of immune populations. (C) Representative bar graph indicating the frequencies of immune cell populations. Data are represented as mean. (D) Heatmap illustrating the differential expression of cell population markers in different time points after infection.

