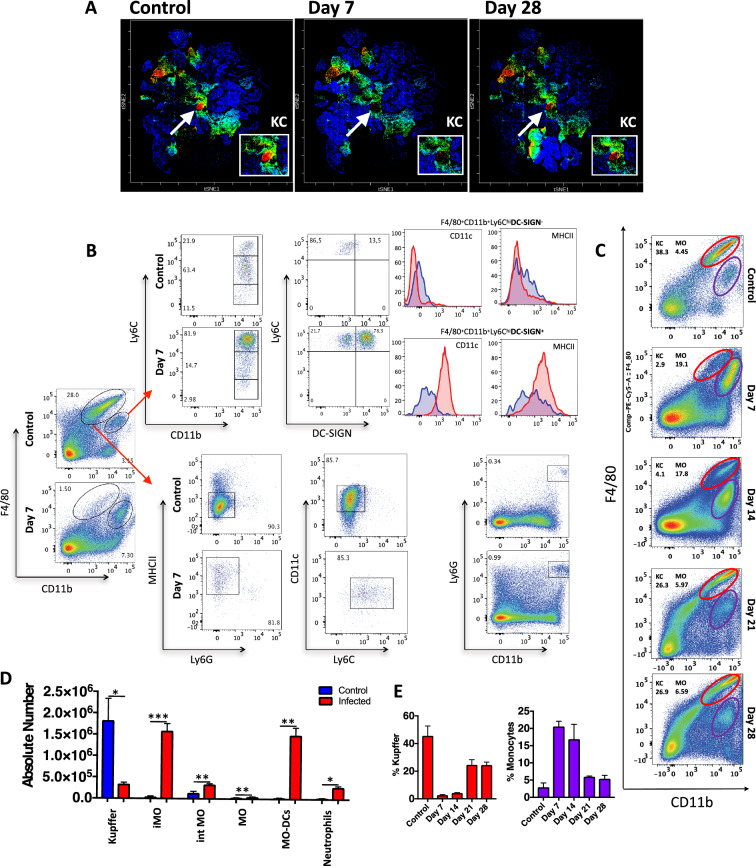
Figure 3.
Number of Kupffer cells in the liver during acute phase of P. chabaudi. (A) Density dot plot CyTOF showing clustered population based on F4/80 expression. (B) Flow cytometry gating strategy to immunophenotyped liver non-parenchymal cells. (C) Flow cytometry kinetic of Kupffer cells F4/80highCD11b+ and (D) Number of different leukocytes per liver following P. chabaudi infection on day 7 post-infection (n = 5). (E) Bar graphs represent the percentage of Kupffer cells and monocytes following P. chabaudi infection. The data shown are representative of 4 independent experiments. Statistical significance comparing infected and non-infected mice (Student’s t test, *p < 0.05, **p < 0.01, ***p < 0.001).

